GMJ Medicine
eISSN : 2626-3041

Embase

Biosis Previews
description
Volume 2, Issue 4 (2023)
GMJM 2023, 2(4): 133-141 |
Back to browse issues page
Article Type:
Subject:


History
Received: 2023/03/12 | Accepted: 2023/10/3 | Published: 2023/11/20
Received: 2023/03/12 | Accepted: 2023/10/3 | Published: 2023/11/20
How to cite this article
Motiei F. Fuzzy Data Envelopment Analysis Method in Evaluating Supply Chain Efficiency in Medical Equipment. GMJM 2023; 2 (4) :133-141
URL: http://gmedicine.de/article-2-212-en.html
URL: http://gmedicine.de/article-2-212-en.html
Download citation:
BibTeX | RIS | EndNote | Medlars | ProCite | Reference Manager | RefWorks
Send citation to:


Rights and permissions
BibTeX | RIS | EndNote | Medlars | ProCite | Reference Manager | RefWorks
Send citation to:

Authors
F. Motiei *
Department of Industrial, Engineering, Arak Branch, Islamic Azad University, Arak, Iran
Keywords:
| Abstract (HTML) (1688 Views)
Full-Text: (1198 Views)
Introduction
In terms of costs, the reserves are estimated to account for about 25 to 30 percent of the hospital's operating costs; Therefore, it is necessary to manage these two cases carefully in order to achieve the goals of service and cost. The structure of this supply chain is shown in the figure below. Early manufacturers are involved in creating the active ingredient of pharmaceutical products. Due to the need to avoid contamination of products, there are long downtimes in production to clean the line and start batch production. The healthcare supply chain includes a flow of different types of products and the involvement of different stakeholders. The main purpose of this chain is to deliver goods and services on time to meet the needs of suppliers. Based on this performance, stakeholders are divided into three main categories: producer, buyer, supplier [1-3]. The role of manufacturers is to produce medical products such as surgical supplies, medical equipment and medicine. Buyers include distributors, wholesalers, and group purchasing organizations (GOPs). Distributors and wholesalers maintain inventory for manufacturers to facilitate the delivery of goods. GOPs sign purchase agreements with manufacturers to benefit economically with the participation of more suppliers. Healthcare providers who are at the bottom of the healthcare supply chain and provide services to patients include hospitals, integrated delivery networks (IDNs), physiotherapists, clinics, nurses, and pharmacies. In the past, a hospital that controlled its purchasing costs was more efficient. Today, the cost of managing materials can exceed 45% of a hospital's operating budget. Recent studies have shown that a large portion of health care chain costs will be reduced by implementing an efficient supply chain. The healthcare sector has changed rapidly over the past decade. Due to increasing competition, the growing impact of patient support associations, and the need to provide effective and efficient health care services, many health care organizations have initiated patient procurement projects, clinical crossings, exchanges, and vertical integration initiatives. In addition, redesigning hospital services and implementing integrated care programs has been cited as a vital strategy to reduce resource utilization and improve the quality of health services. Over the past ten years, a significant number of studies in various fields such as economics, organizational behavior, and logistics have increased our knowledge in these areas (excluding health care). From a management. Supply chain perspective, however, our body of information is not yet complete with regard to the healthcare sector. Although many health care organizations have recognized the importance of adopting supply chain management practices, the application of techniques, methods, and best practices that were initially developed in industrial settings is often problematic. Undoubtedly, the complexity of the technology used, the existence of multiple stakeholders, the dynamic internal and external environment, and the distinctive features of health care operations often preclude the direct use of industrial supply chain management practices. Most projects with the goal of implementing integrated planning systems with respect to patient flows and establishing connections between different health care organizations face difficulties when adopting a supply chain management philosophy [4-6].
Health performance from the perspective of supply chain management
Over the past four decades, the focus within industrial companies has slowly shifted from a strong focus on the processes themselves to the chain. Manufacturing companies control and control their processes for the need to be competitive. During this period, the mainstream of research in operations management led to many mathematical models. Over the past decades, the importance of studying corporate supply chain management has been highlighted. Both in theory and in practice, by integrating information and material flow across the entire supply chain, both internal and external performance of supply chain partners can be significantly improved [7-9]. From an operations management perspective, the focus on the healthcare sector is on optimizing each process. Well-known examples are the application of operations research techniques in optimizing drug inventory levels and methods in optimizing the ordering process for care-related and drug-related goods. Compared to developments in the industrial sector, information and communication technology can play an important role in improving the health supply chain. Recent research has shown that a large portion of health care costs can be reduced by implementing efficient supply chains. The application of supply chain management in the healthcare sector is not only related to physical goods such as medicine, medical equipment, and health care, but also to the patient's flow [10].
Information technology and e-commerce applications are closely linked to the integration and coordination of operational processes. Many studies have defended the importance of the role of information technology in supply chains, and it is therefore not surprising that many health research studies emphasize the role of information technology in hospital supply chains. Similar to the coordination and integration of operational processes, information technology in the health sector is related to both physical products as well as the patient flow within and between departments of health organizations. Examples of IT applications can be found in the areas of purchasing, inventory control, and material planning [11-13]. The application of the electronic patient registration system is also a clear example of the integration of information technology implemented in the health sector around the world. Many studies, however, have reported significant issues when implementing the patient's electronic registration system. It is widely accepted that patient-related information systems can work together to improve the integration and streamlining of processes within and between healthcare providers. Specifically, many stakeholders are involved in the use of the health care supply chain; Thus, the application of supply chain management in the healthcare sector is approximately the same. The use of supply chain management practices in a healthcare setting almost defines organizational aspects such as building relationships, assigning responsibilities and responsibilities, and organizing interface processes. Various studies have highlighted the importance of organizational processes when implementing management, supply chain management exercises. In addition, recent studies reveal that components such as organizational culture, lack of strong management and coercion, as well as the power and communication of interests between stakeholders, can severely impede the integration and coordination of processes throughout the health care supply chain. Integrating management, supply chain, and health care is not only related to the integration and coordination of planning processes, but can also be related to both market development and the introduction of new care products. In the automotive industry, it is a common practice for supply chain partners to collaborate in the process of developing new products. Product development is a well-known phenomenon in the field of supply chain management. Within the industrial supply chain, joint efforts are made to create new products across suppliers, customers, and organizational units. It is also interesting to note that similar developments can be seen in the healthcare supply chain [14-16]. Examples of health care providers can communicate with patient groups about the services provided. In doing so, they emphasize the benefits of intensive collaboration between health care organizations for customers in terms of production time, quality of care, and services provided. In addition, healthcare providers in different countries have worked closely together to develop new healthcare products. It is clear that the integration modes mentioned above cannot be considered in isolation. Studies of industrial companies show that organizations often go through several stages of integration, starting with the stage of transparency through commitment / coordination to the stage of complete integration, which includes all the different forms of integration mentioned above. The ongoing transformation within the healthcare sector toward better integration and a more process-oriented healthcare chain requires changes in control strategy, structure, and mechanization. Similarly, supply chain orientation in the healthcare sector can be considered as a complex process of social.
Change In 2000, Chrome provided a framework for classifying the supply chain literature. They identify two dimensions and form a matrix for categorizing research in supply chain management. This classification also seems to be appropriate for regulating the health care supply chain [17-19].
Implementing supply chain strategy and managing it is one of the most important and vital steps in the production and consumption cycle by the end consumer of a product or service. Today, information in a supply chain is an important factor for making optimal decisions for development and survival, and therefore includes the two goals of coordination, forecasting and planning. Given the importance of information flow and its role in the supply chain, it can be said that the supply chain has three special characteristics compared to individual firms, which are more coverage, more access channels and better information quality. Information technology effectively improves supply chain efficiency and prevents the effect of leather whipping. Simulation of a model to illustrate the supply chain in new situations where information is scarce and conditions of uncertainty. Reasons such as high cost and impossibility have led to supply chain simulation to test and test specific processes. The main processes of supply chain include information management, logistics management, relationship management and strategic management, the benefits of which were generally discussed in this article. One of the factors for the success of organizations and their products is to have an efficient and effective supply chain and its proper management, in which the regular movement of information between members of the supply chain is very important. In this regard, the use of information chain systems and technology and software can support the supply chain and cause communication with the customer and transfer information from the customer to the organization and provide information with a high degree of transparency, speed and accuracy. They do all the process planning based on that.
- Determining the efficiency evaluation model: This is done according to the nature of the type of supply chain under study and the type of industry in which the supply chain is active.
- Determining the evaluation indicators: In this stage, according to the nature of the selected model, in the previous stage, the evaluation indicators are selected using the balanced scorecard model. It should be noted that an attempt should be made to select at least one criterion for evaluation from all available categories of indicators.
- Data collection of indicators and evaluation: In this
stage, the information of selected indicators in the previous stage is collected and evaluated using the selected model in the first stage and the performance of the supply chain is measured [20].
Data Envelopment Analysis
The survival of firms and organizations in any economic system depends on the creation of added value. To achieve this, not only having sufficient resources, but also how to combine and use resources, as well as creating a balance between inputs and outputs of the organization, in other words, the establishment of a performance appraisal system plays an important role. The importance of this evaluation is such that based on the experiences done in industrialized countries, it is possible to increase productivity by 5 to 10% simply by announcing, establishing and implementing a performance evaluation system and even without any changes in the organization or investment (21). Data envelopment analysis is a method based on mathematical programming for performance estimation. This method, without assuming the shape of production functions, by solving mathematical models for a set of decision-making units and using information about the actual inputs and outputs of those units, builds a virtual unit with the highest performance and measures inefficient units with it.
Definition of function and set of production possibility
The function of a unit is to compare its inputs and outputs with each other. In the simplest case, when a unit consumes an input and delivers an output, the function is defined as the output of the output on the input. Consider a unit that produces output y by consuming input x (Figure 1) we explain:
(1)
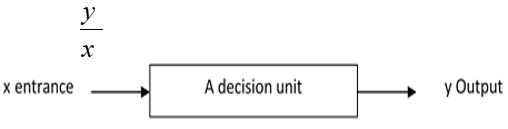
Figure 1) A decision unit with one output and one input
It is often unavoidable to consider multiple inputs and multiple outputs due to the complexity of the decision-making units. Suppose the decision-making unit uses the input vector to produce the output vector (Figure 2).
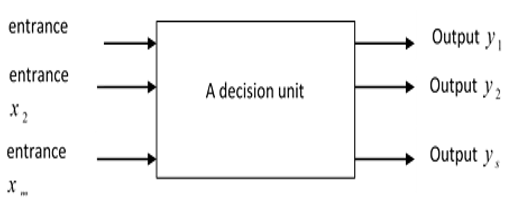
Figure 2) A decision unit and its outputs and inputs
In such a situation, performance can be defined as the product of the division and weighting of outputs by the weighting of inputs. If for the above decision unit, the weight (price) of all outputs is known and the weight (cost) of each input is also known, the performance is calculated from Equation (2):
Where ur the output weight is rm yr and vi weight xi .
To evaluate the performance of a decision unit (DMU) we need a production function. In most cases, the production function is not available, and this is due to the complexity of the production process, changes in production technology and the multiplicity of production functions. That is, in most cases, a combination of inputs produces an output like a vector (x1, x2, ..., xm), so we have to have an approximation of the output function (y1, y2, ..., ym). The output function is a function that gives the maximum output for each order of inputs. With the production function, the performance of a decision unit can be easily calculated. But as mentioned, the production function is not easily calculated for various reasons. Therefore, we make a set called a production set possible and take its boundary approximately from the production function. The production function obtained from the set is the possibility of producing an approximate boundary that has the desired characteristics according to the production technology. The set of production possibilities, denoted by T, is defined as follows:
(3)
T = {(x, y) | can produce y as a negative vector can x as a negative vector}
Consider the set T to be true of the following principles:
1- Principle of Inclusion of Observations: (x, y)ϵT, j=1, 2, ..., n This principle tells us that all observations belong to the set of possibility of production.
2- Principle of Infinity of Radiation (Return to Scale): By accepting this principle, we assume that the technology of production has a return to constant scale. That is, as mentioned earlier, if x produces y, then it also produces 𝜆x, (𝜆≥0) and.
3- Principle of feasibility: If (x1, y1)ϵT, then for whatever (x, y) we have in it, x≥x1 and y≤y1
4- Principle of convexity: By accepting this principle, we accept that in production technology, if (x1, y1), (x2, y2)ϵT we have for each 0≤𝜆≤1: 𝜆(x1, y1)+𝜆(x2, y2)ϵT
5- The principle of minimum interpolation: By accepting this principle, we accept that T is the smallest set that applies to the first to fourth principles.
The set shows the possibility of producing T, which applies to principles one to five.
It turns out that the set is as follows:
That is, the above set is the smallest set that applies in principles one to four.
Charans, Cooper and Rhodes models
Suppose DMUj (j=1, 2, ..., n) that n is a homogeneous number of DMUs that, using the input vector xj , (j=1, 2, ..., n) produce yj the output vector (j=1, 2, ..., n) .
Suppose the goal is to evaluate the performance DMUo in which oϵ{1, 2, ..., n} . For this purpose, we say that if Tc it is not found in the possibility (x, y) of a product that is dominant (xo, yo), then DMUo it is a relative efficiency, otherwise it is inefficient. How can it be said that Tc there is DMUo no possibility of production in existence that prevails? There are three ways to do this (Ramanathan, 2003):
1- If it is possible to find Tc a product that xo has an equal output with less than one input yo .
2- If it is possible to find Tc a product that xo has more than one output with equal input yo .
3- If it is possible to find Tc a product that xo has more than one input and more output yo .
Input-oriented and output-oriented models
In data envelopment analysis models, there are three types of orientation with input nature, with output nature and with basic nature. Input-oriented data envelopment analysis model: In models with input nature, decision-making units seek with the least the amount of input may generate a certain amount of output (in these cases the inputs are controllable) [21-23].
Output-Oriented Data Envelopment Analysis Model: In models with the nature of output, the decision-making units seek to produce the maximum possible output with a certain amount of input (in this case, both inputs and outputs are controllable).
Advantages and disadvantages of data envelopment analysis
The data envelopment analysis model, like other models, includes features including positive and negative features, which are the distinguishing features of this method:
In this evaluation, inefficient units were not evaluated as inefficient due to comparison with a predetermined standard level or a known functional form, but were evaluated by other decision-making units that operate under the same conditions. There are other methods.
This method is a combination of factors and there is no limit to single input and single output.
This method has a compensatory feature and allows the decision-making unit to compensate for the lack of weakness of its outputs with the help of other outputs or the additional consumption of its inputs by saving on other inputs. Data envelopment analysis, unlike the conventional numerical index method, does not require the introduction of predetermined weights for output and input factors. It also does not need to describe functions in the way that is common in statistical regression. Data Envelopment Analysis uses mathematical programming method that can use a large number of variables and relationships (constraints) and the limited number of available outputs and inputs. It does not have other methods. Strong mathematical programming theory allows for better analysis and interpretation. Simplicity in calculating and evaluating and no limitation in the selection of factors allow for more complex issues in the areas of management and policy-making. Any decision unit that is in at least one superior input is evaluated efficiently, which will make some units that have weaknesses in all but one indicator unrealistically evaluated as efficient. Due to the fact that the performance boundary in data envelopment analysis models is based on observations, this causes problems in evaluation. In this form, units A and C are on the border and are evaluated efficiently, but as can be seen, unit A cannot be considered a better unit than B. This means that data envelopment analysis does not succeed in ranking. Another drawback of data envelopment analysis is the assumption of convexity in constructing a collection that makes it possible to produce it. This assumption causes some inefficient decision-making units to be compared to units on the performance frontier that do not exist externally. The comparison of units is relative, and if a unit is evaluated efficiently in an evaluation, it does not mean that this unit is an ideal unit, but among the observations, no unit has been found that performs better than the unit being evaluated. Under these circumstances, data envelopment analysis does not offer any improvement strategy for such units.
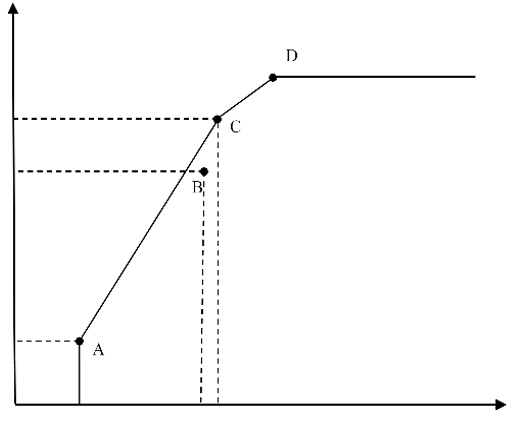
Figure 3) Shows one of the weaknesses of the data envelopment analysis model
The geAneral concept of a balanced scorecard
Performance appraisal and management are the result of the organization's strategic plans and operational plans. Although formulating strategic and operational plans is a complex and difficult process, its successful implementation is far more difficult. Many organizations fail to fully implement their strategies. This is not due to an incomplete definition of the organization's strategies and operational plans, but probably because there is no solid framework for aligning staff and operational processes with the organization's goals. Today's organizations are well aware that 80% of their value-added through their intangible assets, including human capital (knowledge and skills of employees), organizational capital (organizational culture and values) and information capital (information resources) And statistical data) are created and can no longer rely solely on tangible assets to evaluate performance and subsequently perform comprehensive performance management. Prof. Robert Kaplan and Dr. David Norton, understanding the requirements and needs of new organizations and to implement the strategy effectively and create a comprehensive management system and improve performance, in 1992 introduced a new management system called the Balanced Scorecard. The balanced scorecard management system has been proposed as a comprehensive framework for evaluating the performance and advancement of the strategy, which creates a balance between short-term and long-term goals, financial and non-financial metrics, internal and external performance, internal and external stakeholders, guiding indicators and Performance function leads. The Balanced Scorecard is a proven framework that describes and implements an organization's strategy. Balanced Scorecard is a management system that can manage the execution of strategies and measure the performance of the organization in four perspectives: financial, customer, internal processes, and growth and learning, and cause the transfer and understanding of the mission, vision, Organize strategies and performance expectations for all internal and external stakeholders. In other words, a balanced scorecard can show the vision and mission of the organization in the form of a set of cause and effect relationships in the four perspectives mentioned. The Balanced Scorecard management system is a combination of performance appraisal criteria that include past, current and future performance indicators and place non-financial metrics alongside financial metrics. At the same time, it provides a comprehensive view of what is happening inside and outside the organization to the managers of the organization. The Balanced Scorecard Framework consists of four interrelated components. These four components are:
A. Strategy map that identifies the strategic goals of the organization and presents them in the form of cause-and-effect relationships. If these goals are achieved, it means that the strategy has been successfully implemented. The main function of a strategy map is to show in the form of cause-and-effect relationships how strategic objectives should interact with each other to execute the strategy.
B. Performance metrics that track and present the extent to which progress is being made toward strategic goals.
C. Quantitative goals that are set to achieve each of the performance metrics.
D. Designing (selecting) and implementing strategic initiatives (initiatives) in order to connect the performance of the organization to quantitative goals and, finally, to achieve strategic goals.
It should be noted that drawing a strategy map is the most important component for creating a balanced scorecard and therefore should be in the first stage of designing and implementing a balanced scorecard system.
The Balanced Scorecard can provide a performance appraisal system that goes beyond and is more comprehensive than conventional management accounting systems. In this method, in addition to financial indicators, the status of the organization with other indicators of three perspectives, in a cause-and-effect relationship is measured and evaluated. In fact, a balanced scorecard establishes a cause-and-effect relationship between the various components of the organization and views the organization as a single, integrated body. Also, the balanced scorecard is able to connect the strategy to the goals and executive and operational plans of the organization in the form of a comprehensive management system.
Introduction of balanced scorecard funds
The Balanced Scorecard complements financial indicators of past performance with indicators of future performance determinants. The goals and indicators of the scorecard are determined from the strategy and vision of the organization. These goals and indicators look at the organization's performance in four ways: financial, customer, internal processes, and training and learning.
Customer face
In the case of a balanced scorecard customer, managers first determine the customer and market segments in which they want to compete. The designated segments will include current and potential customers and markets. This feature of the scorecard includes several main general indicators and a series of sub-indicators. The main indicators are customer satisfaction, customer retention, new customer attraction, customer profitability and market share in competing market and customer segments. Another series of indicators of this aspect are related to measuring the factors that create value for the customer and thus determine the status of the main indicators.
Value creation factors for customers are classified into three groups:
1- Product or service characteristics include customer waiting time, price, quality, mode of operation, and uniqueness (differentiation) of the product or service.
2- The customer's mental image of the organization and its reputation and credibility, which includes people's perception of the quality of the goods sold and the trust and accuracy of the organization's work.
3- Customer relationship including trustworthiness, reliability and speed of the organization's response to the customer and after-sales service.
Aspects of internal processes
In terms of the Balanced Scorecard internal processes, managers first identify the key internal processes that need to be emphasized in order to implement the strategy. These processes enable the organization to create value to attract and retain the desired customer and meet shareholder expectations. Each business unit has a set of specific processes to create value for customers and financial results for shareholders. The scorecard approach selects the value chain model as a general model for use in internal processes, which includes three processes of innovation, operational processes and after-sales service.
Financial means
In this case, the balanced scorecard, the economic results of the implementation of strategies, are measured. As in pre-strategic planning systems and control systems according to them, financial performance could be measured by indicators such as operating profit and return on investment and value added, in the balanced scorecard, as an approach to measurement and as a result, a tool for controlling financial performance is measured by similar ratios and indicators. The scorecard approach also emphasizes that at different stages of an organization's life cycle (growth, consolidation, harvest) the values of financial indicators will be completely different and goal setting without considering this will cause the organization to deviate from its long-term goals.
The aspect of teaching and learning
Organizational learning and growth come from the three basic sources of human resources, information systems, and organizational guidelines and procedures. The level of access to special capabilities and capabilities in these resources is measured in terms of learning and growth of the scorecard. In order to measure the objectives related to this aspect, factors such as customer access to information and internal processes by managers and operational staff regarding information systems and the extent of alignment of personnel motivations with the mission and goals of the organization regarding organizational instructions and procedures are evaluated. In other words, a balanced scorecard can be defined as a set of carefully selected criteria from the organization's strategy. The criteria selected for the scorecard for managers
is a tool to communicate with staff and stakeholders to convey results and performance incentives that will enable the organization to achieve its mission and strategic goals.
Supply Chain Performance Evaluation Criteria
Aside from designing new products, improving product performance can improve a company's competitive edge. This includes the use of new technology and even a new method of management. It may not be easy to make the connection between performance and innovation. Innovation is not just about physical products, new management methods or new strategies as innovations can also help improve performance. It is difficult to directly measure the impact of new technology, but performance enhancement can be measured directly. The effect of reduced percentage technology on the time required to produce a product is similar.
Gunaskaran et al. examined supply chain performance indicators in four categories of supply chain activities (processes) including (1) planning, (2) sourcing, (3) manufacturing/assembly, and (4) delivery/customer. In this research, by sending 150 questionnaires to different companies and reviewing their answers, the degree of importance of each indicator has been calculated [10].
Order preparation time
Total order cycle time, the order cycle time to delivery, which is defined as the time between receiving the customer order and delivering the finished goods to the customer. A reduction in
order cycle time reduces the supply chain response time, which is itself an important performance indicator and a source of competitive advantage.
Scope of products and services
A factory that produces a wide range of products is likely to introduce new products more slowly than a factory that has a small range of products. Factories that produce a wide range of products are likely to operate in value-added areas with lower per capita delivery speed and reliability. This makes it clear that the range of products affects the performance of the supply chain [24].
Capacity utilization
The role played by the capacity index in determining the level of activity of a supply chain is almost important. Capacity utilization directly affects the speed of responding to customer demand in the form of dealing with flexibility, procurement time and deliverability.
Number of factors without defects
A factor indicates the date, time and conditions of delivery of goods. By comparing pre-determined factors and agreements, it can be determined whether a good and complete delivery has taken place or not, or whether disputed areas can be identified and improved. Flexibility of delivery systems to meet customers 'needs: This indicator refers to the flexibility to meet customers' specific requests for delivery at the place and type of delivery and the type of packaging agreed upon. This type of flexibility can influence customers' decisions in choosing the place of orders and therefore can be used as an important issue to trap and retain customers.
Customer search time
Customer search time refers to the time a company spends responding to a customer search with the information it needs. It is not uncommon for customers to inquire about ordering conditions, potential inventory problems, and deliveries. A quick and accurate response to these requests is important to keep customers satisfied.
Information processing costs
This criterion includes costs such as costs related to order entry, tracking and updating the order, discounts and billing. The role of information technology has become a general possibility for managers to search databases, an advanced process controller that can monitor activities and determine the appropriate path for information. Modern information technology, by using its power to provide accurate, timed and reliable information, has led to better integration of modern supply chains.
Conclusion
As a general conclusion, this study shows that physicians are able to accurately diagnose dislocation and reduction in cases of non-fracture shoulder dislocations. Shoulder radiography should be requested at a time when the physician is unsure of the condition of the joint. In the first dislocation or with the mechanism of radiographic shock should be done before reduction. In these patients, postoperative radiography should be limited to cases with fractures or suspected. Therefore, it seems that when the physician determines the condition of the shoulder joint through examination and history, shoulder radiography does not add a new point that changes the patient's treatment process. Systems and technology needed for supply chain management (scm) management activities are readily available, but many of the initial failures in the supply chain are due to poor transmission of expectations and the result of the behaviors we engage in. The chain occurs. In addition, the most important factor for successful supply chain management is reliable communication between the partners in the chain so that the partners have mutual trust in each other's capabilities and operations. The issue of evaluating the actual supply chain efficiency considered for this dissertation is taken from the furniture industry.
Acknowledgements: None declared by the authors.
Ethical Permission: None declared by the authors.
Conflicts of Interests: None declared by the authors.
Funding/Support: None declared by the authors.
In terms of costs, the reserves are estimated to account for about 25 to 30 percent of the hospital's operating costs; Therefore, it is necessary to manage these two cases carefully in order to achieve the goals of service and cost. The structure of this supply chain is shown in the figure below. Early manufacturers are involved in creating the active ingredient of pharmaceutical products. Due to the need to avoid contamination of products, there are long downtimes in production to clean the line and start batch production. The healthcare supply chain includes a flow of different types of products and the involvement of different stakeholders. The main purpose of this chain is to deliver goods and services on time to meet the needs of suppliers. Based on this performance, stakeholders are divided into three main categories: producer, buyer, supplier [1-3]. The role of manufacturers is to produce medical products such as surgical supplies, medical equipment and medicine. Buyers include distributors, wholesalers, and group purchasing organizations (GOPs). Distributors and wholesalers maintain inventory for manufacturers to facilitate the delivery of goods. GOPs sign purchase agreements with manufacturers to benefit economically with the participation of more suppliers. Healthcare providers who are at the bottom of the healthcare supply chain and provide services to patients include hospitals, integrated delivery networks (IDNs), physiotherapists, clinics, nurses, and pharmacies. In the past, a hospital that controlled its purchasing costs was more efficient. Today, the cost of managing materials can exceed 45% of a hospital's operating budget. Recent studies have shown that a large portion of health care chain costs will be reduced by implementing an efficient supply chain. The healthcare sector has changed rapidly over the past decade. Due to increasing competition, the growing impact of patient support associations, and the need to provide effective and efficient health care services, many health care organizations have initiated patient procurement projects, clinical crossings, exchanges, and vertical integration initiatives. In addition, redesigning hospital services and implementing integrated care programs has been cited as a vital strategy to reduce resource utilization and improve the quality of health services. Over the past ten years, a significant number of studies in various fields such as economics, organizational behavior, and logistics have increased our knowledge in these areas (excluding health care). From a management. Supply chain perspective, however, our body of information is not yet complete with regard to the healthcare sector. Although many health care organizations have recognized the importance of adopting supply chain management practices, the application of techniques, methods, and best practices that were initially developed in industrial settings is often problematic. Undoubtedly, the complexity of the technology used, the existence of multiple stakeholders, the dynamic internal and external environment, and the distinctive features of health care operations often preclude the direct use of industrial supply chain management practices. Most projects with the goal of implementing integrated planning systems with respect to patient flows and establishing connections between different health care organizations face difficulties when adopting a supply chain management philosophy [4-6].
Health performance from the perspective of supply chain management
Over the past four decades, the focus within industrial companies has slowly shifted from a strong focus on the processes themselves to the chain. Manufacturing companies control and control their processes for the need to be competitive. During this period, the mainstream of research in operations management led to many mathematical models. Over the past decades, the importance of studying corporate supply chain management has been highlighted. Both in theory and in practice, by integrating information and material flow across the entire supply chain, both internal and external performance of supply chain partners can be significantly improved [7-9]. From an operations management perspective, the focus on the healthcare sector is on optimizing each process. Well-known examples are the application of operations research techniques in optimizing drug inventory levels and methods in optimizing the ordering process for care-related and drug-related goods. Compared to developments in the industrial sector, information and communication technology can play an important role in improving the health supply chain. Recent research has shown that a large portion of health care costs can be reduced by implementing efficient supply chains. The application of supply chain management in the healthcare sector is not only related to physical goods such as medicine, medical equipment, and health care, but also to the patient's flow [10].
Information technology and e-commerce applications are closely linked to the integration and coordination of operational processes. Many studies have defended the importance of the role of information technology in supply chains, and it is therefore not surprising that many health research studies emphasize the role of information technology in hospital supply chains. Similar to the coordination and integration of operational processes, information technology in the health sector is related to both physical products as well as the patient flow within and between departments of health organizations. Examples of IT applications can be found in the areas of purchasing, inventory control, and material planning [11-13]. The application of the electronic patient registration system is also a clear example of the integration of information technology implemented in the health sector around the world. Many studies, however, have reported significant issues when implementing the patient's electronic registration system. It is widely accepted that patient-related information systems can work together to improve the integration and streamlining of processes within and between healthcare providers. Specifically, many stakeholders are involved in the use of the health care supply chain; Thus, the application of supply chain management in the healthcare sector is approximately the same. The use of supply chain management practices in a healthcare setting almost defines organizational aspects such as building relationships, assigning responsibilities and responsibilities, and organizing interface processes. Various studies have highlighted the importance of organizational processes when implementing management, supply chain management exercises. In addition, recent studies reveal that components such as organizational culture, lack of strong management and coercion, as well as the power and communication of interests between stakeholders, can severely impede the integration and coordination of processes throughout the health care supply chain. Integrating management, supply chain, and health care is not only related to the integration and coordination of planning processes, but can also be related to both market development and the introduction of new care products. In the automotive industry, it is a common practice for supply chain partners to collaborate in the process of developing new products. Product development is a well-known phenomenon in the field of supply chain management. Within the industrial supply chain, joint efforts are made to create new products across suppliers, customers, and organizational units. It is also interesting to note that similar developments can be seen in the healthcare supply chain [14-16]. Examples of health care providers can communicate with patient groups about the services provided. In doing so, they emphasize the benefits of intensive collaboration between health care organizations for customers in terms of production time, quality of care, and services provided. In addition, healthcare providers in different countries have worked closely together to develop new healthcare products. It is clear that the integration modes mentioned above cannot be considered in isolation. Studies of industrial companies show that organizations often go through several stages of integration, starting with the stage of transparency through commitment / coordination to the stage of complete integration, which includes all the different forms of integration mentioned above. The ongoing transformation within the healthcare sector toward better integration and a more process-oriented healthcare chain requires changes in control strategy, structure, and mechanization. Similarly, supply chain orientation in the healthcare sector can be considered as a complex process of social.
Change In 2000, Chrome provided a framework for classifying the supply chain literature. They identify two dimensions and form a matrix for categorizing research in supply chain management. This classification also seems to be appropriate for regulating the health care supply chain [17-19].
Implementing supply chain strategy and managing it is one of the most important and vital steps in the production and consumption cycle by the end consumer of a product or service. Today, information in a supply chain is an important factor for making optimal decisions for development and survival, and therefore includes the two goals of coordination, forecasting and planning. Given the importance of information flow and its role in the supply chain, it can be said that the supply chain has three special characteristics compared to individual firms, which are more coverage, more access channels and better information quality. Information technology effectively improves supply chain efficiency and prevents the effect of leather whipping. Simulation of a model to illustrate the supply chain in new situations where information is scarce and conditions of uncertainty. Reasons such as high cost and impossibility have led to supply chain simulation to test and test specific processes. The main processes of supply chain include information management, logistics management, relationship management and strategic management, the benefits of which were generally discussed in this article. One of the factors for the success of organizations and their products is to have an efficient and effective supply chain and its proper management, in which the regular movement of information between members of the supply chain is very important. In this regard, the use of information chain systems and technology and software can support the supply chain and cause communication with the customer and transfer information from the customer to the organization and provide information with a high degree of transparency, speed and accuracy. They do all the process planning based on that.
- Determining the efficiency evaluation model: This is done according to the nature of the type of supply chain under study and the type of industry in which the supply chain is active.
- Determining the evaluation indicators: In this stage, according to the nature of the selected model, in the previous stage, the evaluation indicators are selected using the balanced scorecard model. It should be noted that an attempt should be made to select at least one criterion for evaluation from all available categories of indicators.
- Data collection of indicators and evaluation: In this
stage, the information of selected indicators in the previous stage is collected and evaluated using the selected model in the first stage and the performance of the supply chain is measured [20].
Data Envelopment Analysis
The survival of firms and organizations in any economic system depends on the creation of added value. To achieve this, not only having sufficient resources, but also how to combine and use resources, as well as creating a balance between inputs and outputs of the organization, in other words, the establishment of a performance appraisal system plays an important role. The importance of this evaluation is such that based on the experiences done in industrialized countries, it is possible to increase productivity by 5 to 10% simply by announcing, establishing and implementing a performance evaluation system and even without any changes in the organization or investment (21). Data envelopment analysis is a method based on mathematical programming for performance estimation. This method, without assuming the shape of production functions, by solving mathematical models for a set of decision-making units and using information about the actual inputs and outputs of those units, builds a virtual unit with the highest performance and measures inefficient units with it.
Definition of function and set of production possibility
The function of a unit is to compare its inputs and outputs with each other. In the simplest case, when a unit consumes an input and delivers an output, the function is defined as the output of the output on the input. Consider a unit that produces output y by consuming input x (Figure 1) we explain:
(1)
Figure 1) A decision unit with one output and one input
It is often unavoidable to consider multiple inputs and multiple outputs due to the complexity of the decision-making units. Suppose the decision-making unit uses the input vector to produce the output vector (Figure 2).
Figure 2) A decision unit and its outputs and inputs
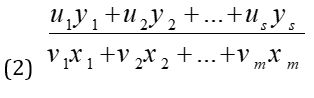
In such a situation, performance can be defined as the product of the division and weighting of outputs by the weighting of inputs. If for the above decision unit, the weight (price) of all outputs is known and the weight (cost) of each input is also known, the performance is calculated from Equation (2):
Where ur the output weight is rm yr and vi weight xi .
To evaluate the performance of a decision unit (DMU) we need a production function. In most cases, the production function is not available, and this is due to the complexity of the production process, changes in production technology and the multiplicity of production functions. That is, in most cases, a combination of inputs produces an output like a vector (x1, x2, ..., xm), so we have to have an approximation of the output function (y1, y2, ..., ym). The output function is a function that gives the maximum output for each order of inputs. With the production function, the performance of a decision unit can be easily calculated. But as mentioned, the production function is not easily calculated for various reasons. Therefore, we make a set called a production set possible and take its boundary approximately from the production function. The production function obtained from the set is the possibility of producing an approximate boundary that has the desired characteristics according to the production technology. The set of production possibilities, denoted by T, is defined as follows:
(3)
T = {(x, y) | can produce y as a negative vector can x as a negative vector}
Consider the set T to be true of the following principles:
1- Principle of Inclusion of Observations: (x, y)ϵT, j=1, 2, ..., n This principle tells us that all observations belong to the set of possibility of production.
2- Principle of Infinity of Radiation (Return to Scale): By accepting this principle, we assume that the technology of production has a return to constant scale. That is, as mentioned earlier, if x produces y, then it also produces 𝜆x, (𝜆≥0) and.
3- Principle of feasibility: If (x1, y1)ϵT, then for whatever (x, y) we have in it, x≥x1 and y≤y1
4- Principle of convexity: By accepting this principle, we accept that in production technology, if (x1, y1), (x2, y2)ϵT we have for each 0≤𝜆≤1: 𝜆(x1, y1)+𝜆(x2, y2)ϵT
5- The principle of minimum interpolation: By accepting this principle, we accept that T is the smallest set that applies to the first to fourth principles.
The set shows the possibility of producing T, which applies to principles one to five.
It turns out that the set is as follows:
That is, the above set is the smallest set that applies in principles one to four.
Charans, Cooper and Rhodes models
Suppose DMUj (j=1, 2, ..., n) that n is a homogeneous number of DMUs that, using the input vector xj , (j=1, 2, ..., n) produce yj the output vector (j=1, 2, ..., n) .
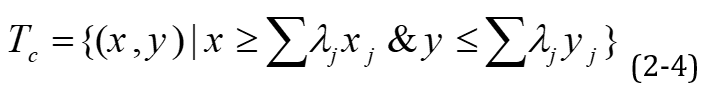
Suppose the goal is to evaluate the performance DMUo in which oϵ{1, 2, ..., n} . For this purpose, we say that if Tc it is not found in the possibility (x, y) of a product that is dominant (xo, yo), then DMUo it is a relative efficiency, otherwise it is inefficient. How can it be said that Tc there is DMUo no possibility of production in existence that prevails? There are three ways to do this (Ramanathan, 2003):
1- If it is possible to find Tc a product that xo has an equal output with less than one input yo .
2- If it is possible to find Tc a product that xo has more than one output with equal input yo .
3- If it is possible to find Tc a product that xo has more than one input and more output yo .
Input-oriented and output-oriented models
In data envelopment analysis models, there are three types of orientation with input nature, with output nature and with basic nature. Input-oriented data envelopment analysis model: In models with input nature, decision-making units seek with the least the amount of input may generate a certain amount of output (in these cases the inputs are controllable) [21-23].
Output-Oriented Data Envelopment Analysis Model: In models with the nature of output, the decision-making units seek to produce the maximum possible output with a certain amount of input (in this case, both inputs and outputs are controllable).
Advantages and disadvantages of data envelopment analysis
The data envelopment analysis model, like other models, includes features including positive and negative features, which are the distinguishing features of this method:
In this evaluation, inefficient units were not evaluated as inefficient due to comparison with a predetermined standard level or a known functional form, but were evaluated by other decision-making units that operate under the same conditions. There are other methods.
This method is a combination of factors and there is no limit to single input and single output.
This method has a compensatory feature and allows the decision-making unit to compensate for the lack of weakness of its outputs with the help of other outputs or the additional consumption of its inputs by saving on other inputs. Data envelopment analysis, unlike the conventional numerical index method, does not require the introduction of predetermined weights for output and input factors. It also does not need to describe functions in the way that is common in statistical regression. Data Envelopment Analysis uses mathematical programming method that can use a large number of variables and relationships (constraints) and the limited number of available outputs and inputs. It does not have other methods. Strong mathematical programming theory allows for better analysis and interpretation. Simplicity in calculating and evaluating and no limitation in the selection of factors allow for more complex issues in the areas of management and policy-making. Any decision unit that is in at least one superior input is evaluated efficiently, which will make some units that have weaknesses in all but one indicator unrealistically evaluated as efficient. Due to the fact that the performance boundary in data envelopment analysis models is based on observations, this causes problems in evaluation. In this form, units A and C are on the border and are evaluated efficiently, but as can be seen, unit A cannot be considered a better unit than B. This means that data envelopment analysis does not succeed in ranking. Another drawback of data envelopment analysis is the assumption of convexity in constructing a collection that makes it possible to produce it. This assumption causes some inefficient decision-making units to be compared to units on the performance frontier that do not exist externally. The comparison of units is relative, and if a unit is evaluated efficiently in an evaluation, it does not mean that this unit is an ideal unit, but among the observations, no unit has been found that performs better than the unit being evaluated. Under these circumstances, data envelopment analysis does not offer any improvement strategy for such units.
Figure 3) Shows one of the weaknesses of the data envelopment analysis model
The geAneral concept of a balanced scorecard
Performance appraisal and management are the result of the organization's strategic plans and operational plans. Although formulating strategic and operational plans is a complex and difficult process, its successful implementation is far more difficult. Many organizations fail to fully implement their strategies. This is not due to an incomplete definition of the organization's strategies and operational plans, but probably because there is no solid framework for aligning staff and operational processes with the organization's goals. Today's organizations are well aware that 80% of their value-added through their intangible assets, including human capital (knowledge and skills of employees), organizational capital (organizational culture and values) and information capital (information resources) And statistical data) are created and can no longer rely solely on tangible assets to evaluate performance and subsequently perform comprehensive performance management. Prof. Robert Kaplan and Dr. David Norton, understanding the requirements and needs of new organizations and to implement the strategy effectively and create a comprehensive management system and improve performance, in 1992 introduced a new management system called the Balanced Scorecard. The balanced scorecard management system has been proposed as a comprehensive framework for evaluating the performance and advancement of the strategy, which creates a balance between short-term and long-term goals, financial and non-financial metrics, internal and external performance, internal and external stakeholders, guiding indicators and Performance function leads. The Balanced Scorecard is a proven framework that describes and implements an organization's strategy. Balanced Scorecard is a management system that can manage the execution of strategies and measure the performance of the organization in four perspectives: financial, customer, internal processes, and growth and learning, and cause the transfer and understanding of the mission, vision, Organize strategies and performance expectations for all internal and external stakeholders. In other words, a balanced scorecard can show the vision and mission of the organization in the form of a set of cause and effect relationships in the four perspectives mentioned. The Balanced Scorecard management system is a combination of performance appraisal criteria that include past, current and future performance indicators and place non-financial metrics alongside financial metrics. At the same time, it provides a comprehensive view of what is happening inside and outside the organization to the managers of the organization. The Balanced Scorecard Framework consists of four interrelated components. These four components are:
A. Strategy map that identifies the strategic goals of the organization and presents them in the form of cause-and-effect relationships. If these goals are achieved, it means that the strategy has been successfully implemented. The main function of a strategy map is to show in the form of cause-and-effect relationships how strategic objectives should interact with each other to execute the strategy.
B. Performance metrics that track and present the extent to which progress is being made toward strategic goals.
C. Quantitative goals that are set to achieve each of the performance metrics.
D. Designing (selecting) and implementing strategic initiatives (initiatives) in order to connect the performance of the organization to quantitative goals and, finally, to achieve strategic goals.
It should be noted that drawing a strategy map is the most important component for creating a balanced scorecard and therefore should be in the first stage of designing and implementing a balanced scorecard system.
The Balanced Scorecard can provide a performance appraisal system that goes beyond and is more comprehensive than conventional management accounting systems. In this method, in addition to financial indicators, the status of the organization with other indicators of three perspectives, in a cause-and-effect relationship is measured and evaluated. In fact, a balanced scorecard establishes a cause-and-effect relationship between the various components of the organization and views the organization as a single, integrated body. Also, the balanced scorecard is able to connect the strategy to the goals and executive and operational plans of the organization in the form of a comprehensive management system.
Introduction of balanced scorecard funds
The Balanced Scorecard complements financial indicators of past performance with indicators of future performance determinants. The goals and indicators of the scorecard are determined from the strategy and vision of the organization. These goals and indicators look at the organization's performance in four ways: financial, customer, internal processes, and training and learning.
Customer face
In the case of a balanced scorecard customer, managers first determine the customer and market segments in which they want to compete. The designated segments will include current and potential customers and markets. This feature of the scorecard includes several main general indicators and a series of sub-indicators. The main indicators are customer satisfaction, customer retention, new customer attraction, customer profitability and market share in competing market and customer segments. Another series of indicators of this aspect are related to measuring the factors that create value for the customer and thus determine the status of the main indicators.
Value creation factors for customers are classified into three groups:
1- Product or service characteristics include customer waiting time, price, quality, mode of operation, and uniqueness (differentiation) of the product or service.
2- The customer's mental image of the organization and its reputation and credibility, which includes people's perception of the quality of the goods sold and the trust and accuracy of the organization's work.
3- Customer relationship including trustworthiness, reliability and speed of the organization's response to the customer and after-sales service.
Aspects of internal processes
In terms of the Balanced Scorecard internal processes, managers first identify the key internal processes that need to be emphasized in order to implement the strategy. These processes enable the organization to create value to attract and retain the desired customer and meet shareholder expectations. Each business unit has a set of specific processes to create value for customers and financial results for shareholders. The scorecard approach selects the value chain model as a general model for use in internal processes, which includes three processes of innovation, operational processes and after-sales service.
Financial means
In this case, the balanced scorecard, the economic results of the implementation of strategies, are measured. As in pre-strategic planning systems and control systems according to them, financial performance could be measured by indicators such as operating profit and return on investment and value added, in the balanced scorecard, as an approach to measurement and as a result, a tool for controlling financial performance is measured by similar ratios and indicators. The scorecard approach also emphasizes that at different stages of an organization's life cycle (growth, consolidation, harvest) the values of financial indicators will be completely different and goal setting without considering this will cause the organization to deviate from its long-term goals.
The aspect of teaching and learning
Organizational learning and growth come from the three basic sources of human resources, information systems, and organizational guidelines and procedures. The level of access to special capabilities and capabilities in these resources is measured in terms of learning and growth of the scorecard. In order to measure the objectives related to this aspect, factors such as customer access to information and internal processes by managers and operational staff regarding information systems and the extent of alignment of personnel motivations with the mission and goals of the organization regarding organizational instructions and procedures are evaluated. In other words, a balanced scorecard can be defined as a set of carefully selected criteria from the organization's strategy. The criteria selected for the scorecard for managers
is a tool to communicate with staff and stakeholders to convey results and performance incentives that will enable the organization to achieve its mission and strategic goals.
Supply Chain Performance Evaluation Criteria
Aside from designing new products, improving product performance can improve a company's competitive edge. This includes the use of new technology and even a new method of management. It may not be easy to make the connection between performance and innovation. Innovation is not just about physical products, new management methods or new strategies as innovations can also help improve performance. It is difficult to directly measure the impact of new technology, but performance enhancement can be measured directly. The effect of reduced percentage technology on the time required to produce a product is similar.
Gunaskaran et al. examined supply chain performance indicators in four categories of supply chain activities (processes) including (1) planning, (2) sourcing, (3) manufacturing/assembly, and (4) delivery/customer. In this research, by sending 150 questionnaires to different companies and reviewing their answers, the degree of importance of each indicator has been calculated [10].
Order preparation time
Total order cycle time, the order cycle time to delivery, which is defined as the time between receiving the customer order and delivering the finished goods to the customer. A reduction in
order cycle time reduces the supply chain response time, which is itself an important performance indicator and a source of competitive advantage.
Scope of products and services
A factory that produces a wide range of products is likely to introduce new products more slowly than a factory that has a small range of products. Factories that produce a wide range of products are likely to operate in value-added areas with lower per capita delivery speed and reliability. This makes it clear that the range of products affects the performance of the supply chain [24].
Capacity utilization
The role played by the capacity index in determining the level of activity of a supply chain is almost important. Capacity utilization directly affects the speed of responding to customer demand in the form of dealing with flexibility, procurement time and deliverability.
Number of factors without defects
A factor indicates the date, time and conditions of delivery of goods. By comparing pre-determined factors and agreements, it can be determined whether a good and complete delivery has taken place or not, or whether disputed areas can be identified and improved. Flexibility of delivery systems to meet customers 'needs: This indicator refers to the flexibility to meet customers' specific requests for delivery at the place and type of delivery and the type of packaging agreed upon. This type of flexibility can influence customers' decisions in choosing the place of orders and therefore can be used as an important issue to trap and retain customers.
Customer search time
Customer search time refers to the time a company spends responding to a customer search with the information it needs. It is not uncommon for customers to inquire about ordering conditions, potential inventory problems, and deliveries. A quick and accurate response to these requests is important to keep customers satisfied.
Information processing costs
This criterion includes costs such as costs related to order entry, tracking and updating the order, discounts and billing. The role of information technology has become a general possibility for managers to search databases, an advanced process controller that can monitor activities and determine the appropriate path for information. Modern information technology, by using its power to provide accurate, timed and reliable information, has led to better integration of modern supply chains.
Conclusion
As a general conclusion, this study shows that physicians are able to accurately diagnose dislocation and reduction in cases of non-fracture shoulder dislocations. Shoulder radiography should be requested at a time when the physician is unsure of the condition of the joint. In the first dislocation or with the mechanism of radiographic shock should be done before reduction. In these patients, postoperative radiography should be limited to cases with fractures or suspected. Therefore, it seems that when the physician determines the condition of the shoulder joint through examination and history, shoulder radiography does not add a new point that changes the patient's treatment process. Systems and technology needed for supply chain management (scm) management activities are readily available, but many of the initial failures in the supply chain are due to poor transmission of expectations and the result of the behaviors we engage in. The chain occurs. In addition, the most important factor for successful supply chain management is reliable communication between the partners in the chain so that the partners have mutual trust in each other's capabilities and operations. The issue of evaluating the actual supply chain efficiency considered for this dissertation is taken from the furniture industry.
Acknowledgements: None declared by the authors.
Ethical Permission: None declared by the authors.
Conflicts of Interests: None declared by the authors.
Funding/Support: None declared by the authors.
References
1. Beamon BM. Measuring supply chain performance. Int J Prod Manag. 1999;19(3):275-92. [Link] [DOI:10.1108/01443579910249714]
2. Beamon BM, Chen VC. Performance analysis of conjoined supply chains. Int J Prod Res. 2001;39(14):195-218. [Link] [DOI:10.1080/00207540110053156]
3. Chan FT. Performance measurement in a supply Chain. Int J Adv Manuf Technol. 2003;21:534-48. [Link] [DOI:10.1007/s001700300063]
4. Charnes A, Cooper WW, Rhodes E. Measuring the efficiency of decision making units. Eur J Oper Res. 1978;2(6):429-44. [Link] [DOI:10.1016/0377-2217(78)90138-8]
5. Chen Y, Liang L, Yang F. A DEA game model approach to supply chain efficiency. Ann Oper Res. 2006;145(1):5-13. [Link] [DOI:10.1007/s10479-006-0022-y]
6. Comelli M, Fenies P, Tchernev N. A combined financial and physical flows evaluation for logistic process and tactical production planning: Application in a company supply chain. Int J Prod Econ. 2008;112(1):77-95. [Link] [DOI:10.1016/j.ijpe.2007.01.012]
7. Estampe D, Lamouri S, Paris JL, Djelloul SB. A framework for analysing supply chain performance evaluation models. Int J Prod Econ. 2010;142(2):247-58. [Link] [DOI:10.1016/j.ijpe.2010.11.024]
8. Globerson S. Issues in developing a performance criteria system for an organization. Int J Prod Res. 1985;23(4):639-46. [Link] [DOI:10.1080/00207548508904734]
9. Gunasekaran A, Patel C, McGaughey RC. A framework for supply chain performance measurement. Int J Prod Econ. 2004;87(3):333-47. [Link] [DOI:10.1016/j.ijpe.2003.08.003]
10. Gunasekaran A, Patel C, Tirtiroglu E. Performance measures and metrics in a supply chain environment. Int J Oper Prod Manag. 2001;21(1/2):71-87. [Link] [DOI:10.1108/01443570110358468]
11. Guo P, Tanaka H. Fuzzy DEA: a perceptual evaluation method. Fuzzy Sets Syst. 2001;119(1):149-60. [Link] [DOI:10.1016/S0165-0114(99)00106-2]
12. Hwang YD, Lin YC, Jr JL. The performance evaluation of SCOR sourcing process-The case study of Taiwan's TFT-LCD industry. Int J Prod Econ. 2008;115(2):411-23. [Link] [DOI:10.1016/j.ijpe.2007.09.014]
13. Kojima M, Nakashima K, Ohno K. Performance evaluation of SCM in JIT environment. Int J Prod Econ. 2008;115(2):439-43. [Link] [DOI:10.1016/j.ijpe.2007.11.017]
14. Li D, O'Brien C. Integrated decision modelling of supply chain efficiency. Int J Prod Econ. 1999;59(1-3):14-57. [Link] [DOI:10.1016/S0925-5273(98)00097-8]
15. Liang L, Yang F, Cook WD, Zhu J. DEA models for supply chain efficiency evaluation. Ann Oper Res. 2006;145:35-49. [Link] [DOI:10.1007/s10479-006-0026-7]
16. Mapes J, New C, Szwejczewski M. Performance trade‐offs in manufacturing plants. Int J Oper Prod Manag. 1997;17(10):1020-33. [Link] [DOI:10.1108/01443579710177031]
17. Neely A, Gregory M, Platts K. Performance measurement system design: a literature review and research agenda. Int J Oper Prod Manag. 1995;15:80-116. [Link] [DOI:10.1108/01443579510083622]
18. Ross A, Droge C. An integrated benchmarking approach to distribution center performance using DEA modeling. J Oper Manag. 2002;20(1):19-32. [Link] [DOI:10.1016/S0272-6963(01)00087-0]
19. Talluri S, Narasimhan R, Nair A. Vendor performance with supply risk: A chance-constrained DEA approach. Int J Prod Econ. 2006;100(2):212-22. [Link] [DOI:10.1016/j.ijpe.2004.11.012]
20. Thomas DJ, Griffin PM. Coordinated supply chain management. Eur J Oper Res. 1996;94(1):1-15. [Link] [DOI:10.1016/0377-2217(96)00098-7]
21. Wen M, You C, Kang R. A new ranking method to fuzzy data envelopment analysis. Comput Math with Appl. 2010;59(11):3398-404. [Link] [DOI:10.1016/j.camwa.2010.02.034]
22. Wong WP, Wong KY. Supply chain performance measurement system using DEA modeling. Ind Manag Data Syst. 2007;107(3):361-81. [Link] [DOI:10.1108/02635570710734271]
23. Wu D, Olson DL. Supply chain risk, simulation, and vendor selection. Int J Prod Econ. 2008;114(2):645-55. [Link] [DOI:10.1016/j.ijpe.2008.02.013]
24. Xu J, Bin L, Wu D. Rough data envelopment analysis and its application to supply chain performance evaluation. Int J Prod Econ. 2009;122:628-38. [Link] [DOI:10.1016/j.ijpe.2009.06.026]