GMJ Medicine
eISSN : 2626-3041

Embase

Biosis Previews
description
Volume 3, Issue 1 (2024)
GMJM 2024, 3(1): 19-29 |
Back to browse issues page
Article Type:
Subject:


History
Received: 2023/07/10 | Accepted: 2024/01/25 | Published: 2024/03/5
Received: 2023/07/10 | Accepted: 2024/01/25 | Published: 2024/03/5
How to cite this article
Abbasinohoji F, Fazli M, Salehian F, Arabi A. Removal of Malachite Green from Aqueous Solution by LaMnO3 Nanorods as a High-Performance Adsorbent. GMJM 2024; 3 (1) :19-29
URL: http://gmedicine.de/article-2-215-en.html
URL: http://gmedicine.de/article-2-215-en.html
Download citation:
BibTeX | RIS | EndNote | Medlars | ProCite | Reference Manager | RefWorks
Send citation to:


Rights and permissions
BibTeX | RIS | EndNote | Medlars | ProCite | Reference Manager | RefWorks
Send citation to:

1- Department of Chemistry, Semnan University, Semnan, Iran
Keywords:
| Abstract (HTML) (1469 Views)
RT b
Kinetic study
One of the important studies in the adsorption process is the study of the effect of contact time with the adsorbent amount, which is known as the kinetic study. The adsorption kinetics relationship features the chemical and physical adsorbent, the particles of matter adsorbed, and also the effect of the adsorption mechanism. To investigate the mechanism of the adsorption process, such as penetration control and mass transfer, several kinetic models are used in different laboratory conditions.
Pseudo-first-order mode
Adsorption kinetics are used to determine the control mechanism of adsorption processes such as surface adsorption, chemical reaction, or diffusion mechanisms. In the kinetic model of the pseudo-first-order, it is assumed that the rate of change in the resolution of the time-consuming body is directly proportional to changes in the saturation concentration and the amount of adsorbent harvesting with time. The pseudo-first-order kinetic form is shown as follows:
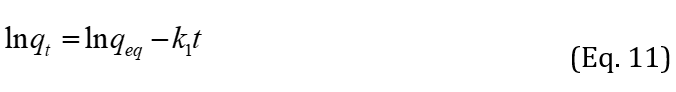
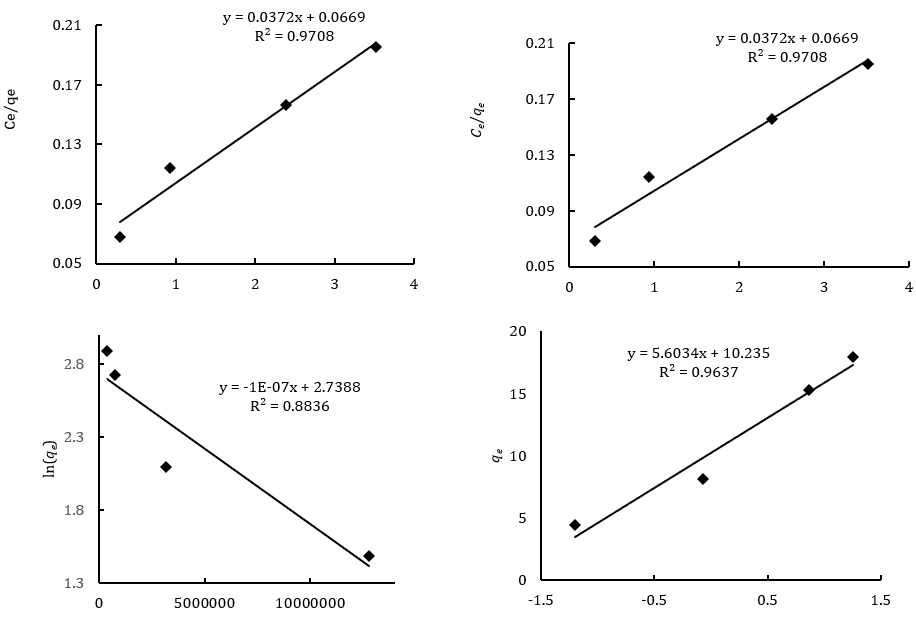
Figure 10. Diagram for adsorption models of MG dye on LaMnO3 nanoparticles. (a) Langmuir isotherm, (b) Freundlich isotherm, (c) Dubinin-Radushkevich and (d) Tempkin isotherm
where qt and qeq are the values of adsorption capacity at time and equilibrium, respectively. k1 (min-1) is the rate constant of the pseudo-first-order, and t is time (min). k1 and qeq were calculated from the plot of lnqt against t (Figure 11). Looking at Table 2, we conclude that the higher correlation coefficient and increased qeq for pseudo-first-order in comparison with pseudo-second-order showed that data of pseudo-first order have a better fit with the experimental data.
Pseudo-second-order mode
In the second-order kinetic model, it is assumed that the adsorption process is controlled by chemical adsorption. The pseudo-second-order is demonstrated by:
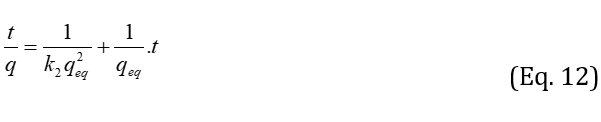
where k2 ( g.mg-1.min-1) is the rate constant of the pseudo-second-order, k2 and qeq were calculated from a plot of t/qt against t (Figure 11). By using pseudo-second-order, we can calculate initial adsorption rates by the following relationship:
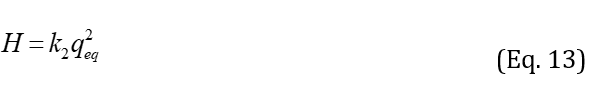
The value of k2 is normally inversely proportional to the initial concentration of adsorbate. The results are displayed in Table 2. The results pointed out that the initial adsorption rate heightens with increasing the initial dye concentration. The maximum initial adsorption rates were attained at the maximum dye concentration.
The intraparticle diffusion model
Adsorption is a thermodynamic system in which different combinations are in competition to achieve equilibrium. To accomplish the surface phenomenon, three distinct steps have to occur. The adsorbed molecules must be transferred from the soluble masses to the surface of the adsorbent particles. In this action, the adsorbing molecules must pass through a solvent film that surrounds the adsorbent. This stage is famous for the process of penetration in the film. Also, the C value obtained from the intrinsic penetration equation (Table 2) was zero and its correlation coefficient was low too. In this way, the intraparticle penetration model of the control factor is not the process kinetic determination [33]. The intraparticle diffusion model is expressed by:
where a kid (mg.g−1.min−1/2) and C are rate constant and constant pertaining to the boundary layer, respectively. Kid and C were calculated from the plot of qt versus t1/2. In the present study, straight lines were attained in MG adsorption on LaMnO3, but the plot did not pass through the origin (Figure 11).
These results demonstrate that intraparticle diffusion affects the rate of MG removal, but it is not the sole rate-controlling step.
Elovich model
Elovich equation is well-suited to explain second-order kinetic and adsorption rates on heterogeneous surfaces. The linear form of this equation [34] is given by:
where α is the initial adsorption rate (mg/g.min), and the parameter β is Elovich constant (g/mg) which are obtained by plotting qt versus lnt. According to Table 2, with increasing dye concentration, we encounter to decrease α (0.720–0.151mg/g.min) and β (1.195–0.3.13g/mg) (Figure 11). This result indicates that adsorption and desorption decreased during increasing dye concentration.
Adsorption thermodynamics
The thermodynamic studies can help us understand the process of absorbing and as a result, we take measures to increase the adsorption efficiency. The thermodynamic parameters reflect the feasibility and process automation of the heat absorption or heat emission reaction and the entropy change during adsorption.
The thermodynamic parameters include Gibbs free energy changes (ΔG0), enthalpy change (ΔH0), and entropy change (ΔS0), which are the most important properties of an adsorption process for practical applications used to determine the relation of the following equation:
in which R is the gas constant, T is the temperature in (K), and Keq is the process equilibrium constant. The negative values of ΔG0 at different temperatures show the spontaneous nature of the adsorption process. The absolute magnitude ΔG0 between -20 and 0KJ/mol is a sign of physical adsorption, and between -80 and -400KJ/mol means chemical adsorption [35]. The values of ΔS0 and ΔH0 can be determined based on the Van't Hoff equation and by plotting the lnKeq diagram in terms of 1/T, (Figure 12) [36].
Given the results obtained in Table 3 and the negative ΔG0s for LaMnO3, it is clear that all adsorption processes are self-absorbed. Moreover, the decrease in ΔG0 values with increasing temperature indicates that the adsorption process is self-sustaining by increasing the temperature. The Gibbs free energy in this study is between 4 and 10KJ/mol, which can be deduced that the adsorption process is physical. The positivity of the enthalpy of adsorption reactions on the LaMnO3 adsorbent suggests that this process is endothermic.
Table 2. Adsorption kinetics constants of MG on LaMnO3 Kinetic parameters of MG adsorption onto LaMnO3 conditions: 0.007g adsorbent over 2.5–12.5mg/l at optima conditions of other variables
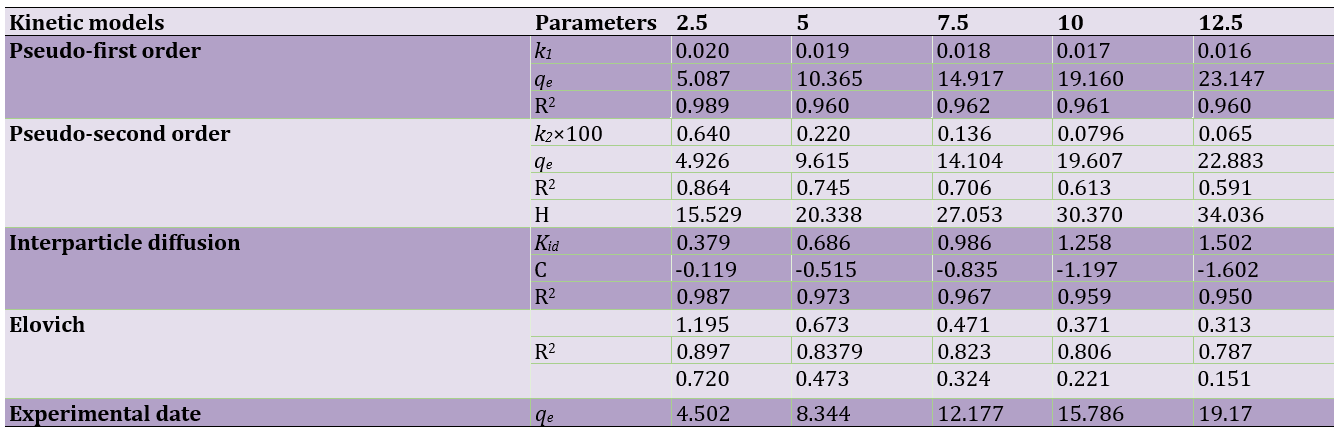
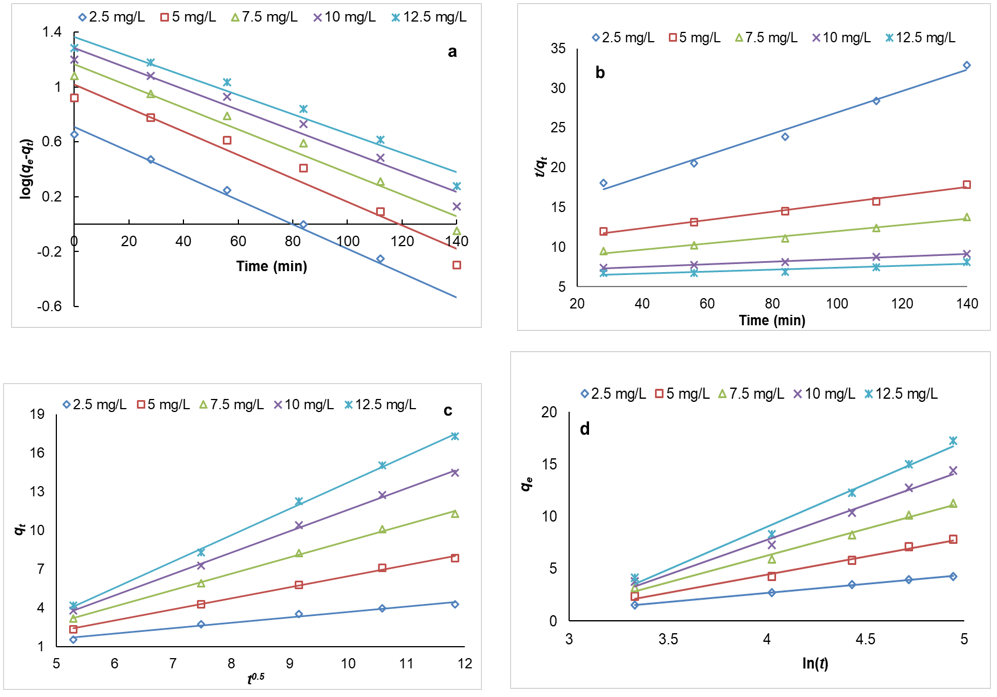
Figure 11. (a) Pseudo-first order plots for uptake of MG onto LaMnO3. (b) Pseudo-second order plots for uptake of MG onto LaMnO3, (c) Intraparticle diffusion model plots for uptake of MG onto LaMnO3, (d) Elovich plots for uptake of MG onto LaMnO3
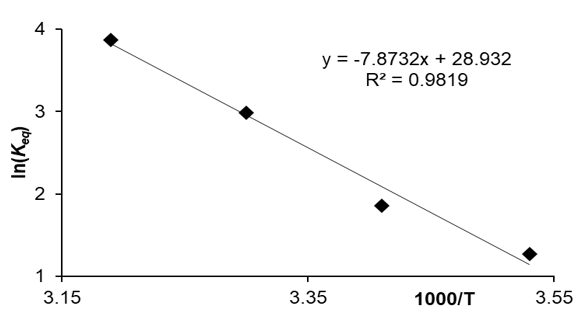
Figure 12. Van’t Hoff diagram for the adsorption of MG.
As a result, according to the Le Chatelier's principle as the temperature rises, the reaction progresses and the maximum adsorption capacity increases (qmax).
Entropy change in adsorption is positive by the LaMnO3 adsorbent, which indicates an increase in irregularity in the solid surface-soluble during adsorption and a slight change in the adsorption and adsorbent structural changes, and thus the irreversibility of the adsorption action.
Table 3) Thermodynamic parameters for the adsorption of MG on LaMnO3
Conclusion
This research demonstrates the effectiveness of LaMnO3 as an affordable and environmentally friendly adsorbent for removing MG from aqueous solutions. In this study, the optimal pH was 5.50 and the best adsorbent dose was 7mg/l. The isotherm Freundlich has a better fit with data than the Langmuir isotherm. The kinetic study of MG on LaMnO3 was performed by pseudo-first order, pseudo-second order, intraparticle, and Elovich models. Pseudo-first-order model is more consistent with the data. The results of the thermodynamic parameters indicate a spontaneous and endothermic process. According to the research, LaMnO3 can be used as a low-cost and environmentally friendly adsorber, and it can also be used to adsorb other cationic and anionic dyes from aquatic environments.
Acknowledgments: None declared by the authors.
Ethical Permissions: None declared by the authors.
Conflicts of Interests: The authors declared no conflict of interest.
Funding/Support: This research did not receive any specific grant from funding agencies in the public, commercial, or not-for-profit sectors.
Full-Text: (859 Views)
Introduction
The waste from the chemical industry, such as the production of paint and pigment, textile, leather, health and beauty, paper and printing, pharmaceuticals, and the like, has large amounts of dye. Due to high resistance to biochemical and toxicity removal, dyestuff compounds create serious and irreversible risks and harm to microorganisms, aquatic environments, and human life [1, 2]. Dyestuffs not only produce toxic and harmful compounds for the environment but also produce other toxic and harmful substances as a result of their participation in various chemical reactions. The malachite green (MG) chemical compound is a cationic compound that is dissolved in water and ethanol, and it is used in various industries, including printing and silk, dyeing wool, linen, leather, paper, and so on [3]. MG has a lot of harmful effects on the immune system and fertility [4] and has the potential for carcinogenesis and gene destruction; therefore, it is essential to remove industrial wastewater [5]. MG’s chemical structure has high resistance to light and oxidizing agents, while its removal based on biological treatment and chemical precipitation has low efficiency [6]. Different physical and chemical methods, such as coagulation and flotation, membranes, ion exchange resin, adsorption, advanced oxidation processes, photocatalytic degradation, etc. [7]. Adsorbents are used for the decomposition and removal of pollutants, such as dyes from urban and industrial wastewater and sewage [8, 9]. The adsorption method, which is based on the transfer of impurities from soluble to solid phase, is known as one of the strong and most commonly used sewage processing methods [10–14]. The use of an adsorption process, particularly on the facade of non-toxic and green sorption with a big face area and reactive outside face, is in huge demand [15]. Also, adsorption is a separation process in which some of the fluid components are transferred to the surface of solid adsorption. The fluid-molecule tendency to stick to the solid surface can be defined as surface adsorption. The approach is preferable to other dye disposal methods in regard to the expense, plainness design, workability, and non-toxicity of the utilized adsorbents compared to other used wastewater processing techniques [16]. The low-cost, obtainable, and adsorptive characteristics are the foremost yardsticks in choosing a sorbent to dispose of natural ingredients from wastewater [17]. Activated carbon may have the widest use of adsorption in removing organic contaminants that are resistant to biological treatment; of course, there are some disadvantages such as relatively high costs, problems with re-production, non-selective performance, and the lack of removal of baking dyes and dispersants. The technology of making good quality carbon is not fully developed in developing countries and there are many problems in providing it [18]. The search for cheap adsorbents that have a high potential for the removal of dye has been very much considered. The main factor in the adsorption system is the adsorbent. The absorbent is the creator of adsorption technology. In the past, the use of adsorbents was based on trial and error, which was measured by testing their quality, but nowadays, in scientific studies, the structure of pores and porosity and surface energy and other parameters of a sorbent is predetermined and dependent on the adsorbent. In a regular molecular structure, the amount of adsorption increases, and the degree of selectivity also increases. At this point in time, oxides with the structure of perovskite are increasing due to the high thermal and chemical resistance in catalysts and adsorption [19, 20]. Perovskite oxides with the formula ABO3 are a very important category of applied materials that have been studied as a catalyst for processes including hydrogenation, decomposition of water, fuel cells, and adsorption [21]. In addition, the high heat and hydrothermal stability enable them to provide suitable catalyst materials for gas or solid reactions that are carried out at high temperatures or by liquid reactions. LaMnO3 is a type of perovskite oxide, which, in addition to its availability, low cost, and environmentally friendly nature, has good electrochemical behavior [22]. Perovskite LaMnO3 is unique due to its electrolytic, magnetic, and catalytic properties [23]. As far as we know, sorption traits of LaMnO3 for removing MG have scarcely been reported. Thus, this is a unique occasion that we decided to construct an official method that synthesizes pure LaMnO3 nanoparticles through a hydrothermal method as an adsorbent to remove MG solution [24]. The impact of adsorbent dosage, initial MG concentration, time, and pH on MG adsorption onto LaMnO3 was studied. Adsorption isotherms, kinetics, and thermodynamic parameters were assessed and made public. Utilizing inexpensive, non-toxic, wide outside face area as eco-friendly sorbent has been studied as a great replacement compound instead of high-priced toxic adsorbent stuff such as MG remover from wastewater.
Materials and Methods
MG dye was purchased from Alwan Company. It was utilized with no more cleansing by mixing distilled water. The dye properties and chemical structure are displayed in (Figure 1). Other chemicals were procured from the German Mercury company. MG was made by dissolving 50mg of the MG in 100ml distilled water. For the hydrothermal synthesis, the following materials and reagents were utilized: La (NO3)3.6H2O, KMnO4, and MnCl2.4H2O were employed as precursors, and KOH was used as the mineralization agents without any impurity.
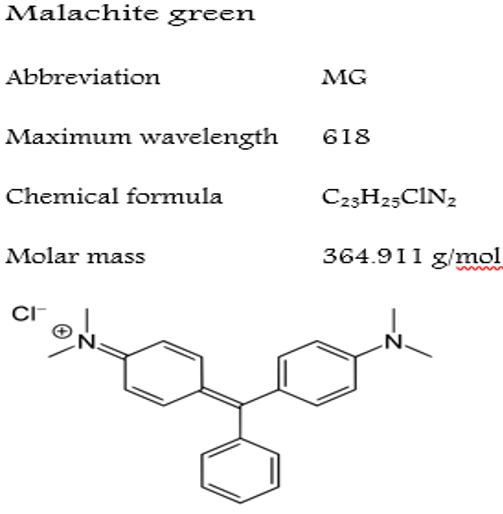
Figure 1G. Physical characteristics of the MG dye
The crystal phase of the product was set by Philips XPert X-ray diffractometer using Co Kα radiation (40kV and 30mA) in 2θ values over 10°–100°. The medium crystallite bigness conforms to the Scherrer equation. FTIR absorption spectra of selected samples before and after heat processing were acquired utilizing KBr discs on an FTIR in the region 400–4000cm-1 by FTIR-8300 spectrophotometer (Shimadzu; Japan). The crystal morphology of the nanopowders was examined by S4160 scanning electron microscopy (Hitachi; Japan). UV–vis 1650 PC spectrophotometer was exploited to get the absorbance spectra of MG dye in the range of 200–800nm by a pair of quartz cells having optical paths of 1cm. PHS-3BW pH-meter (Bell; Italy) with a combined glass–Ag/AgCl electrode was used for adjustment of pH values of test solutions. An ultrasonic bath at 50/60kHz frequency (SW3; Switzerland) was employed to accelerate the dye adsorption process.
Hydrothermal method for preparation of LaMnO3 nanoparticles
The stoichiometric amounts of La (NO3)3.6H2O, KMnO4, and MnCl2.4H2O were utilized as precursors and KOH as the mineralization. A solution with a pure concentration of starting materials (molar ratio La:Mn=1:1) was readied with deionized water (total volume=100ml). As mineralizers, solutions of potassium hydroxide (KOH) were separately added dropwise into the precursor mixtures while being agitated with a magnetic stirrer bar. The composition was hydrothermally processed in 200-mL Teflon-lined stainless steel autoclaves at 200°C for 24h. After normally reducing the temperature to room level, the acquired dye was washed several times with deionized water and dried at 120°C. Then, in the final process, the powdered product was thermally processed in the furnace at 800°C for 6h. After the end of pyrolysis, the samples are sent for XRD, FTIR, FESEM, and UV-Vis absorption spectroscopy analysis.
Adsorption studiesS
The collective sorption testing was done in 60ml crystallizer where 0.007–0.035g of the LaMnO3 and 14ml of the MG solutions (2.5–12.5mg/l) were subjoined after pH adjustment. The crystallizer was eventually closed shut and churned for up to 14min at 300 rpm in an isothermal shaker at room temperature equilibrium. The concentration of the MG in the solution was sized up by a 1650 double-beam UV-Vis spectrophotometer (Shimadzu; Japan) at 618nm. The amount of adsorbed MG at equilibrium qe (mg/g) was figured out by:
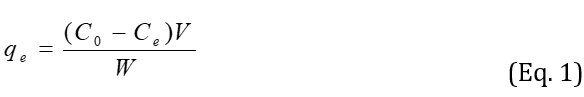
where C0 and Ce (mg/l) are the liquid-phase concentrations of dye and equilibrium, respectively. V (l) volume of the solution and W (g) mass of dry adsorbent used. To explore the impact of solution pH, 0.007g of LaMnO3 was dye solution (14ml, 2.5–12.5mg/l) at room temperature in the pH range of 3.5–7 shaking at 300rpm for 14min to achieve equilibration. The MG concentration in the solution after equilibrium, samples were taken to measure the final concentration of the dye after each test step, passed through a 0.45μm filter and the adsorption of the solution was sized up by UV-Vis spectrophotometer at a wavelength of 618nm.
Adsorption kinetic studies
The aftermath of contact time in the 100ml of MG solution with adsorption in the area of 2.5–12.5mg/l was studied by churning the solution via electromagnetic stirrer at room temperature at 300 rpm having 0.007–0.035g of LaMnO3 homogenously dispersed in the solution. At present time, sections following ultrasonic for 5min at 300rpm the MG concentration was measured and the actual amount of adsorbed MG at time t, qt (mg/g), was calculated based on Eq. (1). Studies varied in the initial MG adsorbent dosages at all conditions, the amount of un-adsorbed MG equilibrium value of adsorbed MG was evaluated using Eq. (1).
Findings and Discussion
Characterization of LaMnO3 nanoparticle
Based on Figure 2, LaMnO3 was determined by X-ray pattern. It is evident that the chief X-ray peaks emerged at 2θ=32.598°, 46.802° and 58.01°. In addition, a sharp peak demonstrates that LaMnO3 achieves nanoparticles. The diffraction peaks presence of LaMnO3 with rhombohedral structure with space group R-3c is confirmed. Moreover, it was found that all the diffraction peaks could be indexed using a rhombohedral structure with a space group. The crystal size of LaMnO3 nanoparticles was calculated according to the following equation:
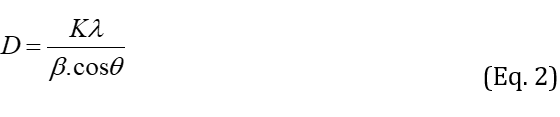
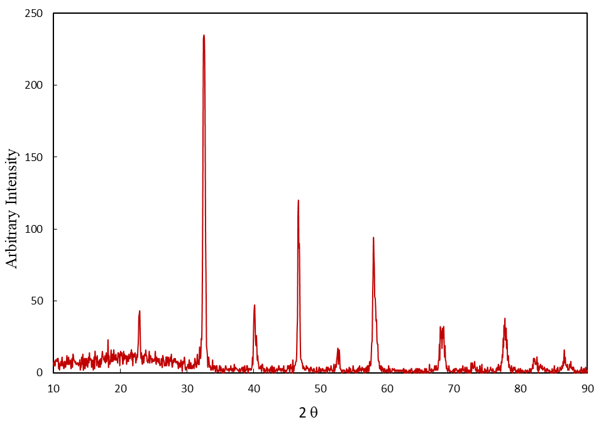
Figure 2. XRD pattern for LaMnO3
Where D is the average size of crystallites (nm), K is the crystallite shape factor (ca. 0.9), λ is the X-ray wavelength, β is the width of the peak is half the maximum height (in terms of the degree to which the length unit must be converted) and θ is the Braggs' angle (deg.). In the ratio of K and cos θ, there are dimensionless, and the dimensions of β and λ must also be of the same genus (unit length). Referring to Eq. (2), the LaMnO3 nanoparticle size is about 21nm [25].
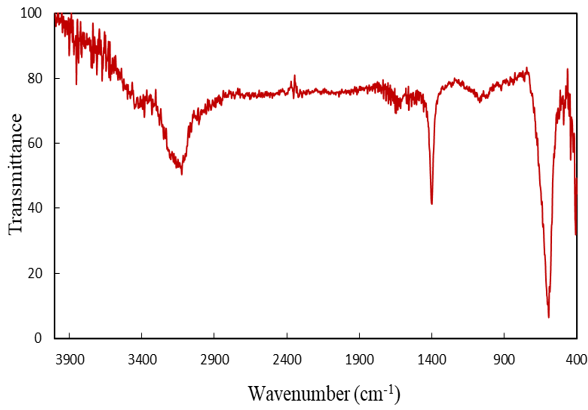
Figure 3. FTIR spectra for LaMnO3
Figure 3 shows the FTIR spectrum of LaMnO3 powder in the range of 400–4000cm-1 wavelengths. The peaks observed at about 3400cm-1 are related to the O–H stretch of the water molecule, which is rapidly absorbed by KBr [26]. The absorption bubble spectrum of about 594 and 486cm-1 can be related to the stretching vibrations of the metal-oxygen bonds (M–O) in the perovskite structure, where M is La, Mn.
The first absorption cavity in the 400cm-1 wavenumber range is La-O, and the second is within the range of the 600cm-1 wave number of Mn–O. In Figure 4, the morphology of the synthesized sample is illustrated by the FESEM test. This figure represents the uniform distribution of monodisperse nanorods. The Digitizer software is used to determine the diameter of the wires on the FESEM image. The results showed that the mean diameter was 42.537nm with a standard deviation of 0.294nm [27]. The specimen morphology prepared under our conditions is completely different from that reported by others. Factors such as ultrasonic and hydrothermal conditions, temperature, time, pH, the concentration of mineralizer, and synthetic conditions affect morphology.
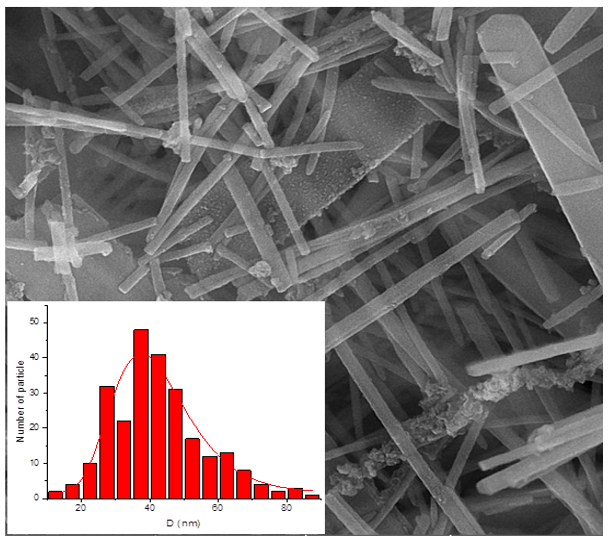
Figure 4. FESEM images of LaMnO3
Effect of contact time and initial MG concentration
The time of adsorption and initial dye concentration are two vital factors in reaching equilibrium. The connection between MG removal and agitating time was investigated at different amounts of adsorbents and initial MG concentration. Furthermore, Figures 5 and 6 show the effect of the initial concentration of MG in the solution on the capacity and equilibrium time of the removal process at pH=5.50.
It was found that equilibrium was attained after 154min of contact time. In other words, by heightening the stirring time, the percentage removal and qe increased, progressively accomplishing equilibrium at 154min. Not only does it indicate that all active sites saturate, but it also indicates that the contribution of film diffusion and intraparticle diffusion in assigning the rate of removal procedure [28]. Conspicuously, for every initial dye concentration, strengthening in adsorbent mass enriches the MG diffusion and successively reduces the time for concluding dye removal. The initial concentration of MG was optimized by a wide range of MG concentration from 2.5 to 12.5mg/l for the adsorbent mass of 0.007g in the time limit of 154min and temperature (313K) respectively. Therefore, at 10mg/l of MG, by altering the adsorbent weight from 0.007 to 0.035g, the removal percentage was increased from 76.16 to 95.29% (See Figure 7). In parallel, boosting in qe from 4.5 to 19.17mg/g was observed (See Figure 8). This indicates that he is directly symmetrical to the initial
MG concentration at constant dose due to transferring mass rate from bulk solution to adsorbent when surface is strong. The experiments were performed at various amounts of adsorbent in the range of (0.007, 0.014, 0.028, 0.035g) at natural temperature (313K), pH=5.50, and different initial concentrations of MG (2.5–12.5mg/l) with limit time.
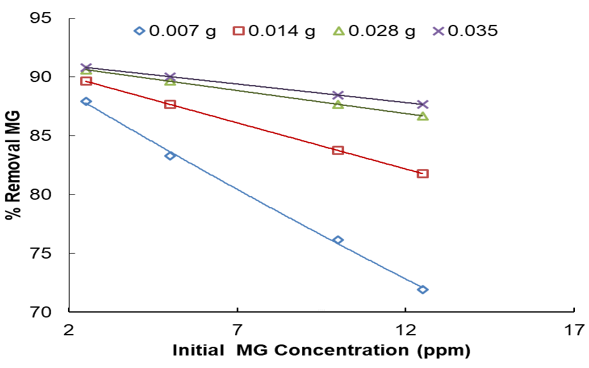
Figure 5. Effect of initial dye concentration on the adsorption of MG
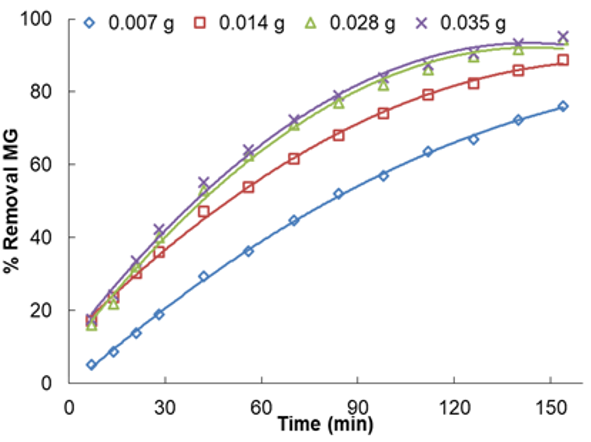
Figure 6. Effect of adsorbent dosage on MG removals in the range of 0.007–0.035g at (pH=5.5, Agitation Speed=300rpm, T=200C)
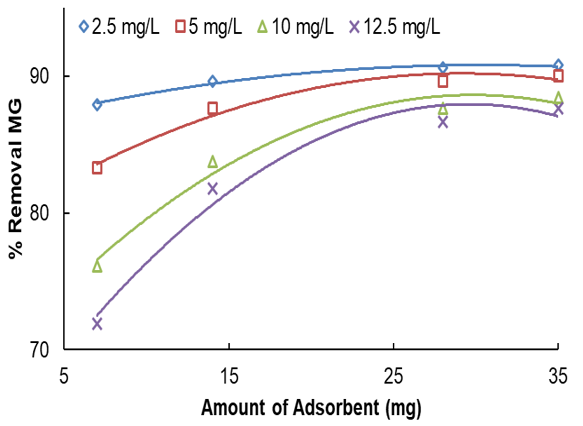
Figure 7. Effect of adsorbent dosage on MG removals in the range of 0.007–0.035g
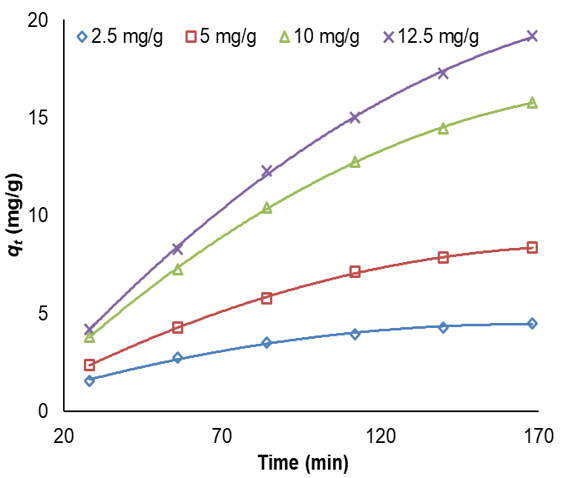
Figure 8. Effect of contact time on adsorption of MG
The higher the removal percentage, the less amount of initial dye concentration and adsorbed MG is decreased. As the initial MG concentration enriched from 2.5 to 12.5mg/l, its removal percentage descended to 90.81 to 71.92% utilizing 0.007 and 0.035g. It is clear in the curves (Figure 8) that the needed contact time for MG solutions with initial concentrations of 2.5–12.5mg/l was under about 160min in all situations. The amount of adsorbed MG is a powerful and positive connection with initial MG concentration. The increase in the adsorption with adsorbent amount can be associated with enhancing the adsorbent surface area and accessibility of more adsorption sites; otherwise, the unit adsorbed of MG declined with an increase in LaMnO3. This subject can be owing to the drop of the whole adsorption surface area accessible to MG caused by collecting or overlapping of adsorption places.
Effect of system pH on MG uptake
The results of the study on the effect of pH on the removal of MG by LaMnO3 showed that pH had a clear effect on the MG removal process, and an increase in pH resulted in a higher adsorption rate. The optimum pH seems to be about 5.50. With a pH addition of 3.50–7.0, the MG removal efficiency at 10mg/l concentration increased (See Figure 9).
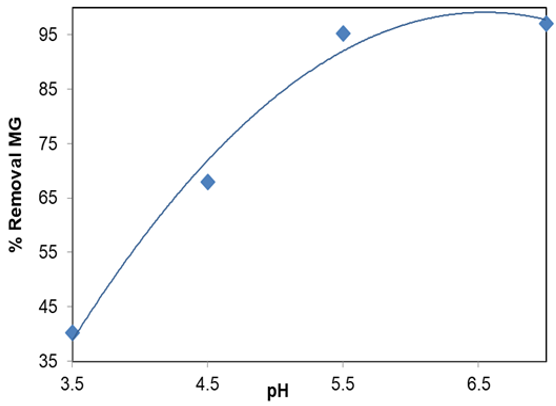
Figure 9. Effect of solution pH on adsorption LaMnO3
Langmuir isotherm
Langmuir isotherm is a semi-empirical isotherm that confirms a proposed kinetic mechanism. This isotherm was based on four assumptions such as uniform adsorbent surface, no interaction between adsorbed molecules, placing all adsorbing through the same mechanism and forming a monolayer at maximum adsorption. The Langmuir isotherm is defined as follows:
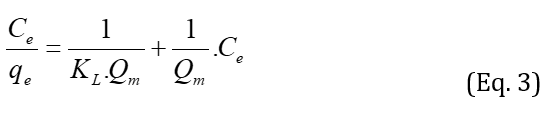
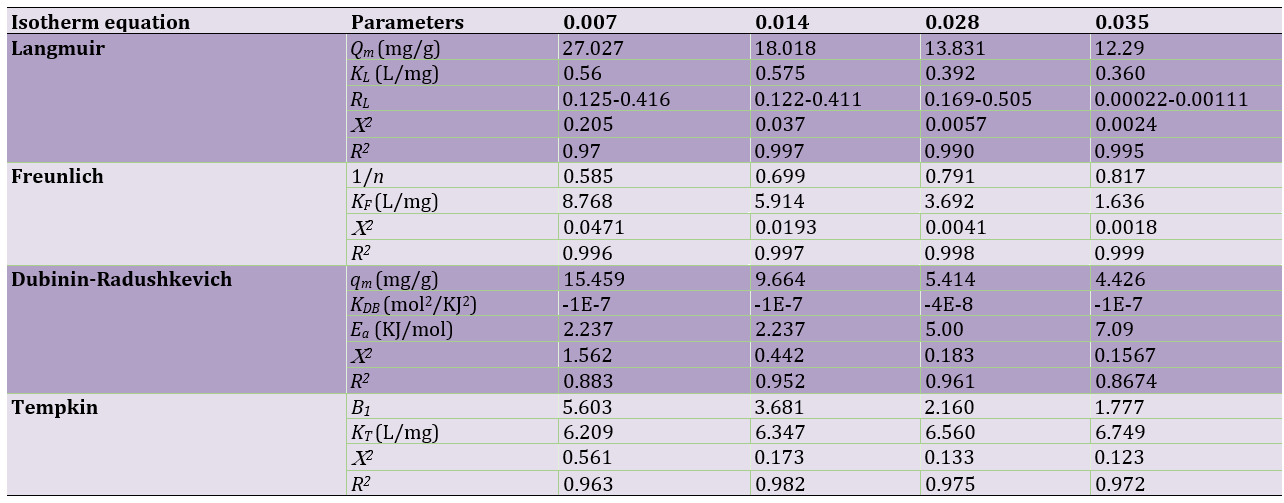
where Qm is the maximum adsorption capacity (mg/g), KL is the Langmuir constant (l/mol), is related to the energy of adsorption, and Ce is a concentration of dye at equilibrium. Values of KL and Qm were calculated from the plot of Ce/qe against Ce. According to Table 1, by increasing the adsorbent dosage, the maximum adsorption capacity decreased from 27.027 to 12.29mg/g. Figure 10 shows a lower correlation of the Langmuir model compared with that of the Freundlich model. The single-layer adsorption has not been carried out on an ideal surface. RL is a necessary parameter to express the favorability of the adsorption process. The RL is calculated by using:
If 0<RL<1, the process is favorable; RL=0, the process is irreversible; RL=1, the process is linear; and if RL>1, that is unfavorable. Referring to Table 1, RL for all amounts of adsorbent is 0<RL<1, which indicates the adsorption is favorable.
Freundlich isotherm
Freundlich equilibrium isotherm is an empirical model that creates a relation between multilayer adsorption and interaction between adsorbent molecules. The linear form of Freundlich isotherm is expressed as follows:
where KF and n are Freundlich constants, which are related to the adsorption capacity of the adsorbent and adsorption intensity, respectively. The values of KF and n were calculated from the plots of lnqe versus lnCe. According to Table 1, 1/n1 indicates favorable adsorption. On the other side, the data for Freundlich isotherm displays a high correlation coefficient (R2=0.9969) and lower error values (X2) for using 0.007–0.035g adsorbent shows that strong evidence on the fitness of equilibrium data of MG adsorption by Freundlich in reference to Figure 10.
Dubinin-Radushkevich isotherm
By using the Freundlich and Langmuir isotherms, the information about the type of adsorption is not obtained [30]. To find the type of adsorption, the Doubinin-Radushkevich isotherm is very useful. The linear form of the equation of D-R isotherm is expressed in:
where qm is a theoretical saturation capacity, KDR is a Dubinin-Radushkevich's constant related to adsorption energy (Mol2/KJ2) and ɛ is Polanyi potential (KJ/mol) [31] calculated from:
where R is the gas constant (8.314J/mol.K), T is the temperature (K), and Ce is the equilibrium concentration (mg/l). By looking at Figure 10, values of qm and KDR are attained by plotting lnqe versus ε2. The average free energy (Ea) of the adsorption is determined [32] by using the:
Table 1 shows the calculated values for the D-R isotherm. The value of Ea displayed for the adsorption process is physical in nature [17].
Table 1. Isotherm constant of MG adsorption onto LaMnO3
Tempkin isotherm
Tempkin isotherm contains a factor that displays the interaction between adsorption and adsorbent particles. The Tempkin isotherm assumes that by increasing the adsorbent surface coating and adsorption heat, all of the molecules are linearly reduced. The Tempkin isotherm can be described by the following equation:
where KT is Tempkin isotherm constant (J/mol) corresponding to the heat of sorption (J/mol) and it is expressed by the expression β1=
The waste from the chemical industry, such as the production of paint and pigment, textile, leather, health and beauty, paper and printing, pharmaceuticals, and the like, has large amounts of dye. Due to high resistance to biochemical and toxicity removal, dyestuff compounds create serious and irreversible risks and harm to microorganisms, aquatic environments, and human life [1, 2]. Dyestuffs not only produce toxic and harmful compounds for the environment but also produce other toxic and harmful substances as a result of their participation in various chemical reactions. The malachite green (MG) chemical compound is a cationic compound that is dissolved in water and ethanol, and it is used in various industries, including printing and silk, dyeing wool, linen, leather, paper, and so on [3]. MG has a lot of harmful effects on the immune system and fertility [4] and has the potential for carcinogenesis and gene destruction; therefore, it is essential to remove industrial wastewater [5]. MG’s chemical structure has high resistance to light and oxidizing agents, while its removal based on biological treatment and chemical precipitation has low efficiency [6]. Different physical and chemical methods, such as coagulation and flotation, membranes, ion exchange resin, adsorption, advanced oxidation processes, photocatalytic degradation, etc. [7]. Adsorbents are used for the decomposition and removal of pollutants, such as dyes from urban and industrial wastewater and sewage [8, 9]. The adsorption method, which is based on the transfer of impurities from soluble to solid phase, is known as one of the strong and most commonly used sewage processing methods [10–14]. The use of an adsorption process, particularly on the facade of non-toxic and green sorption with a big face area and reactive outside face, is in huge demand [15]. Also, adsorption is a separation process in which some of the fluid components are transferred to the surface of solid adsorption. The fluid-molecule tendency to stick to the solid surface can be defined as surface adsorption. The approach is preferable to other dye disposal methods in regard to the expense, plainness design, workability, and non-toxicity of the utilized adsorbents compared to other used wastewater processing techniques [16]. The low-cost, obtainable, and adsorptive characteristics are the foremost yardsticks in choosing a sorbent to dispose of natural ingredients from wastewater [17]. Activated carbon may have the widest use of adsorption in removing organic contaminants that are resistant to biological treatment; of course, there are some disadvantages such as relatively high costs, problems with re-production, non-selective performance, and the lack of removal of baking dyes and dispersants. The technology of making good quality carbon is not fully developed in developing countries and there are many problems in providing it [18]. The search for cheap adsorbents that have a high potential for the removal of dye has been very much considered. The main factor in the adsorption system is the adsorbent. The absorbent is the creator of adsorption technology. In the past, the use of adsorbents was based on trial and error, which was measured by testing their quality, but nowadays, in scientific studies, the structure of pores and porosity and surface energy and other parameters of a sorbent is predetermined and dependent on the adsorbent. In a regular molecular structure, the amount of adsorption increases, and the degree of selectivity also increases. At this point in time, oxides with the structure of perovskite are increasing due to the high thermal and chemical resistance in catalysts and adsorption [19, 20]. Perovskite oxides with the formula ABO3 are a very important category of applied materials that have been studied as a catalyst for processes including hydrogenation, decomposition of water, fuel cells, and adsorption [21]. In addition, the high heat and hydrothermal stability enable them to provide suitable catalyst materials for gas or solid reactions that are carried out at high temperatures or by liquid reactions. LaMnO3 is a type of perovskite oxide, which, in addition to its availability, low cost, and environmentally friendly nature, has good electrochemical behavior [22]. Perovskite LaMnO3 is unique due to its electrolytic, magnetic, and catalytic properties [23]. As far as we know, sorption traits of LaMnO3 for removing MG have scarcely been reported. Thus, this is a unique occasion that we decided to construct an official method that synthesizes pure LaMnO3 nanoparticles through a hydrothermal method as an adsorbent to remove MG solution [24]. The impact of adsorbent dosage, initial MG concentration, time, and pH on MG adsorption onto LaMnO3 was studied. Adsorption isotherms, kinetics, and thermodynamic parameters were assessed and made public. Utilizing inexpensive, non-toxic, wide outside face area as eco-friendly sorbent has been studied as a great replacement compound instead of high-priced toxic adsorbent stuff such as MG remover from wastewater.
Materials and Methods
MG dye was purchased from Alwan Company. It was utilized with no more cleansing by mixing distilled water. The dye properties and chemical structure are displayed in (Figure 1). Other chemicals were procured from the German Mercury company. MG was made by dissolving 50mg of the MG in 100ml distilled water. For the hydrothermal synthesis, the following materials and reagents were utilized: La (NO3)3.6H2O, KMnO4, and MnCl2.4H2O were employed as precursors, and KOH was used as the mineralization agents without any impurity.
Figure 1G. Physical characteristics of the MG dye
The crystal phase of the product was set by Philips XPert X-ray diffractometer using Co Kα radiation (40kV and 30mA) in 2θ values over 10°–100°. The medium crystallite bigness conforms to the Scherrer equation. FTIR absorption spectra of selected samples before and after heat processing were acquired utilizing KBr discs on an FTIR in the region 400–4000cm-1 by FTIR-8300 spectrophotometer (Shimadzu; Japan). The crystal morphology of the nanopowders was examined by S4160 scanning electron microscopy (Hitachi; Japan). UV–vis 1650 PC spectrophotometer was exploited to get the absorbance spectra of MG dye in the range of 200–800nm by a pair of quartz cells having optical paths of 1cm. PHS-3BW pH-meter (Bell; Italy) with a combined glass–Ag/AgCl electrode was used for adjustment of pH values of test solutions. An ultrasonic bath at 50/60kHz frequency (SW3; Switzerland) was employed to accelerate the dye adsorption process.
Hydrothermal method for preparation of LaMnO3 nanoparticles
The stoichiometric amounts of La (NO3)3.6H2O, KMnO4, and MnCl2.4H2O were utilized as precursors and KOH as the mineralization. A solution with a pure concentration of starting materials (molar ratio La:Mn=1:1) was readied with deionized water (total volume=100ml). As mineralizers, solutions of potassium hydroxide (KOH) were separately added dropwise into the precursor mixtures while being agitated with a magnetic stirrer bar. The composition was hydrothermally processed in 200-mL Teflon-lined stainless steel autoclaves at 200°C for 24h. After normally reducing the temperature to room level, the acquired dye was washed several times with deionized water and dried at 120°C. Then, in the final process, the powdered product was thermally processed in the furnace at 800°C for 6h. After the end of pyrolysis, the samples are sent for XRD, FTIR, FESEM, and UV-Vis absorption spectroscopy analysis.
Adsorption studiesS
The collective sorption testing was done in 60ml crystallizer where 0.007–0.035g of the LaMnO3 and 14ml of the MG solutions (2.5–12.5mg/l) were subjoined after pH adjustment. The crystallizer was eventually closed shut and churned for up to 14min at 300 rpm in an isothermal shaker at room temperature equilibrium. The concentration of the MG in the solution was sized up by a 1650 double-beam UV-Vis spectrophotometer (Shimadzu; Japan) at 618nm. The amount of adsorbed MG at equilibrium qe (mg/g) was figured out by:
where C0 and Ce (mg/l) are the liquid-phase concentrations of dye and equilibrium, respectively. V (l) volume of the solution and W (g) mass of dry adsorbent used. To explore the impact of solution pH, 0.007g of LaMnO3 was dye solution (14ml, 2.5–12.5mg/l) at room temperature in the pH range of 3.5–7 shaking at 300rpm for 14min to achieve equilibration. The MG concentration in the solution after equilibrium, samples were taken to measure the final concentration of the dye after each test step, passed through a 0.45μm filter and the adsorption of the solution was sized up by UV-Vis spectrophotometer at a wavelength of 618nm.
Adsorption kinetic studies
The aftermath of contact time in the 100ml of MG solution with adsorption in the area of 2.5–12.5mg/l was studied by churning the solution via electromagnetic stirrer at room temperature at 300 rpm having 0.007–0.035g of LaMnO3 homogenously dispersed in the solution. At present time, sections following ultrasonic for 5min at 300rpm the MG concentration was measured and the actual amount of adsorbed MG at time t, qt (mg/g), was calculated based on Eq. (1). Studies varied in the initial MG adsorbent dosages at all conditions, the amount of un-adsorbed MG equilibrium value of adsorbed MG was evaluated using Eq. (1).
Findings and Discussion
Characterization of LaMnO3 nanoparticle
Based on Figure 2, LaMnO3 was determined by X-ray pattern. It is evident that the chief X-ray peaks emerged at 2θ=32.598°, 46.802° and 58.01°. In addition, a sharp peak demonstrates that LaMnO3 achieves nanoparticles. The diffraction peaks presence of LaMnO3 with rhombohedral structure with space group R-3c is confirmed. Moreover, it was found that all the diffraction peaks could be indexed using a rhombohedral structure with a space group. The crystal size of LaMnO3 nanoparticles was calculated according to the following equation:
Figure 2. XRD pattern for LaMnO3
Where D is the average size of crystallites (nm), K is the crystallite shape factor (ca. 0.9), λ is the X-ray wavelength, β is the width of the peak is half the maximum height (in terms of the degree to which the length unit must be converted) and θ is the Braggs' angle (deg.). In the ratio of K and cos θ, there are dimensionless, and the dimensions of β and λ must also be of the same genus (unit length). Referring to Eq. (2), the LaMnO3 nanoparticle size is about 21nm [25].
Figure 3. FTIR spectra for LaMnO3
Figure 3 shows the FTIR spectrum of LaMnO3 powder in the range of 400–4000cm-1 wavelengths. The peaks observed at about 3400cm-1 are related to the O–H stretch of the water molecule, which is rapidly absorbed by KBr [26]. The absorption bubble spectrum of about 594 and 486cm-1 can be related to the stretching vibrations of the metal-oxygen bonds (M–O) in the perovskite structure, where M is La, Mn.
The first absorption cavity in the 400cm-1 wavenumber range is La-O, and the second is within the range of the 600cm-1 wave number of Mn–O. In Figure 4, the morphology of the synthesized sample is illustrated by the FESEM test. This figure represents the uniform distribution of monodisperse nanorods. The Digitizer software is used to determine the diameter of the wires on the FESEM image. The results showed that the mean diameter was 42.537nm with a standard deviation of 0.294nm [27]. The specimen morphology prepared under our conditions is completely different from that reported by others. Factors such as ultrasonic and hydrothermal conditions, temperature, time, pH, the concentration of mineralizer, and synthetic conditions affect morphology.
Figure 4. FESEM images of LaMnO3
Effect of contact time and initial MG concentration
The time of adsorption and initial dye concentration are two vital factors in reaching equilibrium. The connection between MG removal and agitating time was investigated at different amounts of adsorbents and initial MG concentration. Furthermore, Figures 5 and 6 show the effect of the initial concentration of MG in the solution on the capacity and equilibrium time of the removal process at pH=5.50.
It was found that equilibrium was attained after 154min of contact time. In other words, by heightening the stirring time, the percentage removal and qe increased, progressively accomplishing equilibrium at 154min. Not only does it indicate that all active sites saturate, but it also indicates that the contribution of film diffusion and intraparticle diffusion in assigning the rate of removal procedure [28]. Conspicuously, for every initial dye concentration, strengthening in adsorbent mass enriches the MG diffusion and successively reduces the time for concluding dye removal. The initial concentration of MG was optimized by a wide range of MG concentration from 2.5 to 12.5mg/l for the adsorbent mass of 0.007g in the time limit of 154min and temperature (313K) respectively. Therefore, at 10mg/l of MG, by altering the adsorbent weight from 0.007 to 0.035g, the removal percentage was increased from 76.16 to 95.29% (See Figure 7). In parallel, boosting in qe from 4.5 to 19.17mg/g was observed (See Figure 8). This indicates that he is directly symmetrical to the initial
MG concentration at constant dose due to transferring mass rate from bulk solution to adsorbent when surface is strong. The experiments were performed at various amounts of adsorbent in the range of (0.007, 0.014, 0.028, 0.035g) at natural temperature (313K), pH=5.50, and different initial concentrations of MG (2.5–12.5mg/l) with limit time.
Figure 5. Effect of initial dye concentration on the adsorption of MG
Figure 6. Effect of adsorbent dosage on MG removals in the range of 0.007–0.035g at (pH=5.5, Agitation Speed=300rpm, T=200C)
Figure 7. Effect of adsorbent dosage on MG removals in the range of 0.007–0.035g
Figure 8. Effect of contact time on adsorption of MG
The higher the removal percentage, the less amount of initial dye concentration and adsorbed MG is decreased. As the initial MG concentration enriched from 2.5 to 12.5mg/l, its removal percentage descended to 90.81 to 71.92% utilizing 0.007 and 0.035g. It is clear in the curves (Figure 8) that the needed contact time for MG solutions with initial concentrations of 2.5–12.5mg/l was under about 160min in all situations. The amount of adsorbed MG is a powerful and positive connection with initial MG concentration. The increase in the adsorption with adsorbent amount can be associated with enhancing the adsorbent surface area and accessibility of more adsorption sites; otherwise, the unit adsorbed of MG declined with an increase in LaMnO3. This subject can be owing to the drop of the whole adsorption surface area accessible to MG caused by collecting or overlapping of adsorption places.
Effect of system pH on MG uptake
The results of the study on the effect of pH on the removal of MG by LaMnO3 showed that pH had a clear effect on the MG removal process, and an increase in pH resulted in a higher adsorption rate. The optimum pH seems to be about 5.50. With a pH addition of 3.50–7.0, the MG removal efficiency at 10mg/l concentration increased (See Figure 9).
Figure 9. Effect of solution pH on adsorption LaMnO3
Langmuir isotherm
Langmuir isotherm is a semi-empirical isotherm that confirms a proposed kinetic mechanism. This isotherm was based on four assumptions such as uniform adsorbent surface, no interaction between adsorbed molecules, placing all adsorbing through the same mechanism and forming a monolayer at maximum adsorption. The Langmuir isotherm is defined as follows:
where Qm is the maximum adsorption capacity (mg/g), KL is the Langmuir constant (l/mol), is related to the energy of adsorption, and Ce is a concentration of dye at equilibrium. Values of KL and Qm were calculated from the plot of Ce/qe against Ce. According to Table 1, by increasing the adsorbent dosage, the maximum adsorption capacity decreased from 27.027 to 12.29mg/g. Figure 10 shows a lower correlation of the Langmuir model compared with that of the Freundlich model. The single-layer adsorption has not been carried out on an ideal surface. RL is a necessary parameter to express the favorability of the adsorption process. The RL is calculated by using:
If 0<RL<1, the process is favorable; RL=0, the process is irreversible; RL=1, the process is linear; and if RL>1, that is unfavorable. Referring to Table 1, RL for all amounts of adsorbent is 0<RL<1, which indicates the adsorption is favorable.
Freundlich isotherm
Freundlich equilibrium isotherm is an empirical model that creates a relation between multilayer adsorption and interaction between adsorbent molecules. The linear form of Freundlich isotherm is expressed as follows:
where KF and n are Freundlich constants, which are related to the adsorption capacity of the adsorbent and adsorption intensity, respectively. The values of KF and n were calculated from the plots of lnqe versus lnCe. According to Table 1, 1/n1 indicates favorable adsorption. On the other side, the data for Freundlich isotherm displays a high correlation coefficient (R2=0.9969) and lower error values (X2) for using 0.007–0.035g adsorbent shows that strong evidence on the fitness of equilibrium data of MG adsorption by Freundlich in reference to Figure 10.
Dubinin-Radushkevich isotherm
By using the Freundlich and Langmuir isotherms, the information about the type of adsorption is not obtained [30]. To find the type of adsorption, the Doubinin-Radushkevich isotherm is very useful. The linear form of the equation of D-R isotherm is expressed in:
where qm is a theoretical saturation capacity, KDR is a Dubinin-Radushkevich's constant related to adsorption energy (Mol2/KJ2) and ɛ is Polanyi potential (KJ/mol) [31] calculated from:
where R is the gas constant (8.314J/mol.K), T is the temperature (K), and Ce is the equilibrium concentration (mg/l). By looking at Figure 10, values of qm and KDR are attained by plotting lnqe versus ε2. The average free energy (Ea) of the adsorption is determined [32] by using the:
Table 1 shows the calculated values for the D-R isotherm. The value of Ea displayed for the adsorption process is physical in nature [17].
Table 1. Isotherm constant of MG adsorption onto LaMnO3
Tempkin isotherm
Tempkin isotherm contains a factor that displays the interaction between adsorption and adsorbent particles. The Tempkin isotherm assumes that by increasing the adsorbent surface coating and adsorption heat, all of the molecules are linearly reduced. The Tempkin isotherm can be described by the following equation:
where KT is Tempkin isotherm constant (J/mol) corresponding to the heat of sorption (J/mol) and it is expressed by the expression β1=
Kinetic study
One of the important studies in the adsorption process is the study of the effect of contact time with the adsorbent amount, which is known as the kinetic study. The adsorption kinetics relationship features the chemical and physical adsorbent, the particles of matter adsorbed, and also the effect of the adsorption mechanism. To investigate the mechanism of the adsorption process, such as penetration control and mass transfer, several kinetic models are used in different laboratory conditions.
Pseudo-first-order mode
Adsorption kinetics are used to determine the control mechanism of adsorption processes such as surface adsorption, chemical reaction, or diffusion mechanisms. In the kinetic model of the pseudo-first-order, it is assumed that the rate of change in the resolution of the time-consuming body is directly proportional to changes in the saturation concentration and the amount of adsorbent harvesting with time. The pseudo-first-order kinetic form is shown as follows:
Figure 10. Diagram for adsorption models of MG dye on LaMnO3 nanoparticles. (a) Langmuir isotherm, (b) Freundlich isotherm, (c) Dubinin-Radushkevich and (d) Tempkin isotherm
where qt and qeq are the values of adsorption capacity at time and equilibrium, respectively. k1 (min-1) is the rate constant of the pseudo-first-order, and t is time (min). k1 and qeq were calculated from the plot of lnqt against t (Figure 11). Looking at Table 2, we conclude that the higher correlation coefficient and increased qeq for pseudo-first-order in comparison with pseudo-second-order showed that data of pseudo-first order have a better fit with the experimental data.
Pseudo-second-order mode
In the second-order kinetic model, it is assumed that the adsorption process is controlled by chemical adsorption. The pseudo-second-order is demonstrated by:
where k2 ( g.mg-1.min-1) is the rate constant of the pseudo-second-order, k2 and qeq were calculated from a plot of t/qt against t (Figure 11). By using pseudo-second-order, we can calculate initial adsorption rates by the following relationship:
The value of k2 is normally inversely proportional to the initial concentration of adsorbate. The results are displayed in Table 2. The results pointed out that the initial adsorption rate heightens with increasing the initial dye concentration. The maximum initial adsorption rates were attained at the maximum dye concentration.
The intraparticle diffusion model
Adsorption is a thermodynamic system in which different combinations are in competition to achieve equilibrium. To accomplish the surface phenomenon, three distinct steps have to occur. The adsorbed molecules must be transferred from the soluble masses to the surface of the adsorbent particles. In this action, the adsorbing molecules must pass through a solvent film that surrounds the adsorbent. This stage is famous for the process of penetration in the film. Also, the C value obtained from the intrinsic penetration equation (Table 2) was zero and its correlation coefficient was low too. In this way, the intraparticle penetration model of the control factor is not the process kinetic determination [33]. The intraparticle diffusion model is expressed by:
where a kid (mg.g−1.min−1/2) and C are rate constant and constant pertaining to the boundary layer, respectively. Kid and C were calculated from the plot of qt versus t1/2. In the present study, straight lines were attained in MG adsorption on LaMnO3, but the plot did not pass through the origin (Figure 11).
These results demonstrate that intraparticle diffusion affects the rate of MG removal, but it is not the sole rate-controlling step.
Elovich model
Elovich equation is well-suited to explain second-order kinetic and adsorption rates on heterogeneous surfaces. The linear form of this equation [34] is given by:
where α is the initial adsorption rate (mg/g.min), and the parameter β is Elovich constant (g/mg) which are obtained by plotting qt versus lnt. According to Table 2, with increasing dye concentration, we encounter to decrease α (0.720–0.151mg/g.min) and β (1.195–0.3.13g/mg) (Figure 11). This result indicates that adsorption and desorption decreased during increasing dye concentration.
Adsorption thermodynamics
The thermodynamic studies can help us understand the process of absorbing and as a result, we take measures to increase the adsorption efficiency. The thermodynamic parameters reflect the feasibility and process automation of the heat absorption or heat emission reaction and the entropy change during adsorption.
The thermodynamic parameters include Gibbs free energy changes (ΔG0), enthalpy change (ΔH0), and entropy change (ΔS0), which are the most important properties of an adsorption process for practical applications used to determine the relation of the following equation:
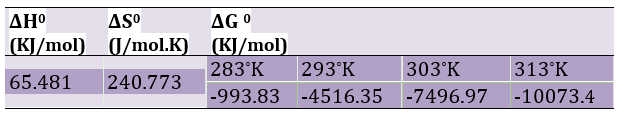
in which R is the gas constant, T is the temperature in (K), and Keq is the process equilibrium constant. The negative values of ΔG0 at different temperatures show the spontaneous nature of the adsorption process. The absolute magnitude ΔG0 between -20 and 0KJ/mol is a sign of physical adsorption, and between -80 and -400KJ/mol means chemical adsorption [35]. The values of ΔS0 and ΔH0 can be determined based on the Van't Hoff equation and by plotting the lnKeq diagram in terms of 1/T, (Figure 12) [36].
Given the results obtained in Table 3 and the negative ΔG0s for LaMnO3, it is clear that all adsorption processes are self-absorbed. Moreover, the decrease in ΔG0 values with increasing temperature indicates that the adsorption process is self-sustaining by increasing the temperature. The Gibbs free energy in this study is between 4 and 10KJ/mol, which can be deduced that the adsorption process is physical. The positivity of the enthalpy of adsorption reactions on the LaMnO3 adsorbent suggests that this process is endothermic.
Table 2. Adsorption kinetics constants of MG on LaMnO3 Kinetic parameters of MG adsorption onto LaMnO3 conditions: 0.007g adsorbent over 2.5–12.5mg/l at optima conditions of other variables
Figure 11. (a) Pseudo-first order plots for uptake of MG onto LaMnO3. (b) Pseudo-second order plots for uptake of MG onto LaMnO3, (c) Intraparticle diffusion model plots for uptake of MG onto LaMnO3, (d) Elovich plots for uptake of MG onto LaMnO3
Figure 12. Van’t Hoff diagram for the adsorption of MG.
As a result, according to the Le Chatelier's principle as the temperature rises, the reaction progresses and the maximum adsorption capacity increases (qmax).
Entropy change in adsorption is positive by the LaMnO3 adsorbent, which indicates an increase in irregularity in the solid surface-soluble during adsorption and a slight change in the adsorption and adsorbent structural changes, and thus the irreversibility of the adsorption action.
Table 3) Thermodynamic parameters for the adsorption of MG on LaMnO3
Conclusion
This research demonstrates the effectiveness of LaMnO3 as an affordable and environmentally friendly adsorbent for removing MG from aqueous solutions. In this study, the optimal pH was 5.50 and the best adsorbent dose was 7mg/l. The isotherm Freundlich has a better fit with data than the Langmuir isotherm. The kinetic study of MG on LaMnO3 was performed by pseudo-first order, pseudo-second order, intraparticle, and Elovich models. Pseudo-first-order model is more consistent with the data. The results of the thermodynamic parameters indicate a spontaneous and endothermic process. According to the research, LaMnO3 can be used as a low-cost and environmentally friendly adsorber, and it can also be used to adsorb other cationic and anionic dyes from aquatic environments.
Acknowledgments: None declared by the authors.
Ethical Permissions: None declared by the authors.
Conflicts of Interests: The authors declared no conflict of interest.
Funding/Support: This research did not receive any specific grant from funding agencies in the public, commercial, or not-for-profit sectors.
References
1. Magdalane CM, Kaviyarasu K, Vijaya JJ, Jayakumar C, Maaza M, Jeyaraj B. Photocatalytic degradation effect of malachite green and catalytic hydrogenation by UV-illuminated Ceo2/Cdo multilayered nanoplatelet arrays: Investigation of antifungal and antimicrobial activities. J Photochem Photobiol B. 2017;169:110-23. [Link] [DOI:10.1016/j.jphotobiol.2017.03.008]
2. Pathania D, Katwal R, Sharma G, Naushad M, Rizwan Khan M, Ala'a H. Novel guar gum/Al2o3 nanocomposite as an effective photocatalyst for the degradation of malachite green dye. Int J Biol Macromol. 2016;87:366-74. [Link] [DOI:10.1016/j.ijbiomac.2016.02.073]
3. Culp SJ, Beland FA. Malachite green: A toxicological review. J Am Coll Toxicol. 1996;15:219-38. [Link] [DOI:10.3109/10915819609008715]
4. Srivastava S, Sinha R, Roy D. Toxicological effects of malachite green. Aquat Toxicol. 2004;66(3):319-29. [Link] [DOI:10.1016/j.aquatox.2003.09.008]
5. Baeissa ES. Photocatalytic degradation of malachite green dye using Au/NaNbO3 nanoparticles. J Alloys Compd. 2016;672:564-70. [Link] [DOI:10.1016/j.jallcom.2016.02.024]
6. Guo X, Wei Q, Du B, Zhang Y, Xin X, Yan L, et al. Removal of basic dyes (Malachite green) from aqueous medium by adsorption onto amino functionalized graphenes in batch mode. Desalin Water Treat. 2015;53(3):818-25. [Link] [DOI:10.1080/19443994.2013.846239]
7. Tahir H, Hammed U, Sultan M, Jahanzeb Q. Batch adsorption technique for the removal of malachite green and fast green dyes by using montmorillonite clay as adsorbent. Afr J Biotechnol. 2010;9(48):8206-14. [Link] [DOI:10.5897/AJB10.911]
8. Saikia L, Bhuyan D, Saikia M, Malakar B, Kumar Dutta D, Sengupta P. Photocatalytic performance of Zno nanomaterials for self sensitized degradation of malachite green dye under solar light. Appl Catal A-Gen. 2015;490:42-9. [Link] [DOI:10.1016/j.apcata.2014.10.053]
9. Sharma S, Mehta SK, Kansal SK. N Doped Zno/C-dots nanoflowers as visible light driven photocatalyst for the degradation of malachite green dye in aqueous phase. J Alloys Compd. 2017;699:323-33. [Link] [DOI:10.1016/j.jallcom.2016.12.408]
10. Gong R, Zhang X, Liu H, Sun Y, Liu B. Uptake of cationic dyes from aqueous solution by biosorption onto granular Kohlrabi peel. Bioresource Technol. 2007;98(6):1319-23. [Link] [DOI:10.1016/j.biortech.2006.04.034]
11. Gouran-Orimi R, Mirzayi B, Nematollahzadeh A, Tardast A. Competitive adsorption of nitrate in fixed bed column packed with bio-inspired polydopamine coated zeolite. J Environ Chem Eng. 2018;6(2):2232-40. [Link] [DOI:10.1016/j.jece.2018.01.049]
12. Gupta S, Babu BV. Modeling, simulation, and experimental validation for continuous Cr (Vi) removal from aqueous solutions using sawdust as an adsorbent. Bioresource Technol. 2009;100(23):5633-40. [Link] [DOI:10.1016/j.biortech.2009.06.025]
13. Gupta VK, Ali I. Adsorbents for water treatment: Development of low-cost alternatives to carbon. Encycl Surf Colloid Sci. 2006;2:149-84. [Link]
14. Mavrogiorgou A, Simaioforidou A, Louloudi M. Pyrolytic Carbon as support matrix for heterogeneous oxidation catalysts: The influence of pyrolytic process on catalytic behavior. J Environ Chem Eng. 2018;6(1):1127-36. [Link] [DOI:10.1016/j.jece.2018.01.040]
15. Dolphen R, Sakkayawong N, Thiravetyan P, Nakbanpote W. Adsorption of reactive red 141 from wastewater onto modified chitin. J Hazard Mater. 2007;145(1-2):250-5. [Link] [DOI:10.1016/j.jhazmat.2006.11.026]
16. Ghaedi M, Khajehsharifi H, Hemmati Yadkuri A, Roosta M, Asghari A. Oxidized multiwalled carbon nanotubes as efficient adsorbent for bromothymol blue. Toxicol Environ Chem. 2012;94(5):873-83. [Link] [DOI:10.1080/02772248.2012.678999]
17. Tahir SS, Rauf N. Removal of a cationic dye from aqueous solutions by adsorption onto bentonite clay. Chemosphere. 2006;63(11):842-8. [Link] [DOI:10.1016/j.chemosphere.2005.10.033]
18. Sawood GM, Gupta SK. Arsenic remediation of the waste water using adsorbent: A review. Int J Eng Sci Technol. 2018;5(1):1054-70. [Link]
19. El Hadri A. Perovskitas hexagonales de hierro: Papel de la subred aniónica en la oxidación catalítica de CO. [Internet]. Madrid: UCM; 2017 [Cited 2021 May 17]. Available from: https://eprints.ucm.es/42589/ [Link]
20. Ghiasi M, Malekzadeh A. Synthesis, characterization and photocatalytic properties of lanthanum oxycarbonate, lanthanum oxide and lanthanum hydroxide nanoparticles. Superlattices Microstruct. 2015;77:295-304. [Link] [DOI:10.1016/j.spmi.2014.09.027]
21. Shaterian M, Enhessari M, Rabbani D, Asghari M, Salavati-Niasari M. Synthesis, characterization and photocatalytic activity of lamno3 nanoparticles. Appl Surf Sci. 2014;318:213-7. [Link] [DOI:10.1016/j.apsusc.2014.03.087]
22. Najjar H, Batis H. Development of Mn-based perovskite materials: Chemical structure and applications. Catal Rev. 2016;58(3):371-438. [Link] [DOI:10.1080/01614940.2016.1198203]
23. Özbay N, Yarbay Şahin RZ. Preparation and characterization of lamno3 and lanio3 perovskite type oxides by the hydrothermal synthesis method. AIP Conf Proc. 2017;1809(1). [Link] [DOI:10.1063/1.4975455]
24. Fruth V, Popa M, Calderon-Moreno J, Tenea E, Anastasescu M, Osiceanu P, et al. Perovskite type nanopowders and thin films obtained by chemical methods. Process Appl Ceram. 2010;4:167-82. [Link] [DOI:10.2298/PAC1003167F]
25. Jung WY, Hong SS. Synthesis of lacoo3 nanoparticles by microwave process and their photocatalytic activity under visible light irradiation. J Ind Eng Chem. 2013;19(1):157-60. [Link] [DOI:10.1016/j.jiec.2012.07.018]
26. Álvarez-Galván MC, VA de La Peña O'Shea, Arzamendi G, Pawelec B, Gandía LM, Fierro JL. Methyl ethyl ketone combustion over la-transition metal (Cr, Co, Ni, Mn) perovskites. Appl Catal B. 2009;92(3-4):445-53. [Link] [DOI:10.1016/j.apcatb.2009.09.006]
27. Arabi A, Fazli M, Ehsani MH. Synthesis and characterization of calcium-doped lanthanum manganite nanowires as a photocatalyst for degradation of methylene blue solution under visible light irradiation. J Mater Sci. 2018;41(77):1-8. [Link] [DOI:10.1007/s12034-018-1590-6]
28. Kong Q, He X, Shu L, Miao MS. Ofloxacin adsorption by activated carbon derived from luffa sponge: Kinetic, isotherm, and thermodynamic analyses. Process Saf Environ Prot. 2017;112:254-64. [Link] [DOI:10.1016/j.psep.2017.05.011]
29. Campos V, Dweck J, Nascimento CA, Tcacenco CM. Thermal stability of ionene polymers. J Therm Anal Calorim. 2013;112:1221-9. [Link] [DOI:10.1007/s10973-012-2694-7]
30. Malik UR, Hasany SM, Subhani MS. Sorptive potential of sunflower stem for cr(iii) ions from aqueous solutions and its kinetic and thermodynamic profile. Talanta. 2005;66(1):166-73. [Link] [DOI:10.1016/j.talanta.2004.11.013]
31. Fil BA, Karcioglu Karakas Z, Boncukcuiglu R, Yilmaz AE. Removal of cationic dye (basic red 18) from aqueous solution using natural Turkish Clay. Global Nest J. 2013;15:529-41. [Link] [DOI:10.30955/gnj.000944]
32. Foo KY, Hameed BH. Insights into the modeling of adsorption isotherm systems. Chem Eng. 2010;156(1):2-10. [Link] [DOI:10.1016/j.cej.2009.09.013]
33. Itodo AU, Abdulrahman FW, Hassan LG, Maigandi SA, Itodo HU. Intraparticle diffusion and intraparticulate diffusivities of herbicide on derived activated carbon. Research. 2010;2(2):74-86. [Link]
34. Chien SH, Clayton W. Application of Elovich equation to the kinetics of phosphate release and sorption in soils. Soil Sci Soc Am J. 1980;44:265-8. [Link] [DOI:10.2136/sssaj1980.03615995004400020013x]
35. Tang H, Zhou W, Zhang L. Adsorption isotherms and kinetics studies of malachite green on chitin hydrogels. J Hazard Mater. 2012;209-210:218-25. [Link] [DOI:10.1016/j.jhazmat.2012.01.010]
36. Yang R, Li D, Li A, Yang H. Adsorption properties and mechanisms of palygorskite for removal of various ionic dyes from water. Appl Clay Sci. 2018;151:20-8. [Link] [DOI:10.1016/j.clay.2017.10.016]